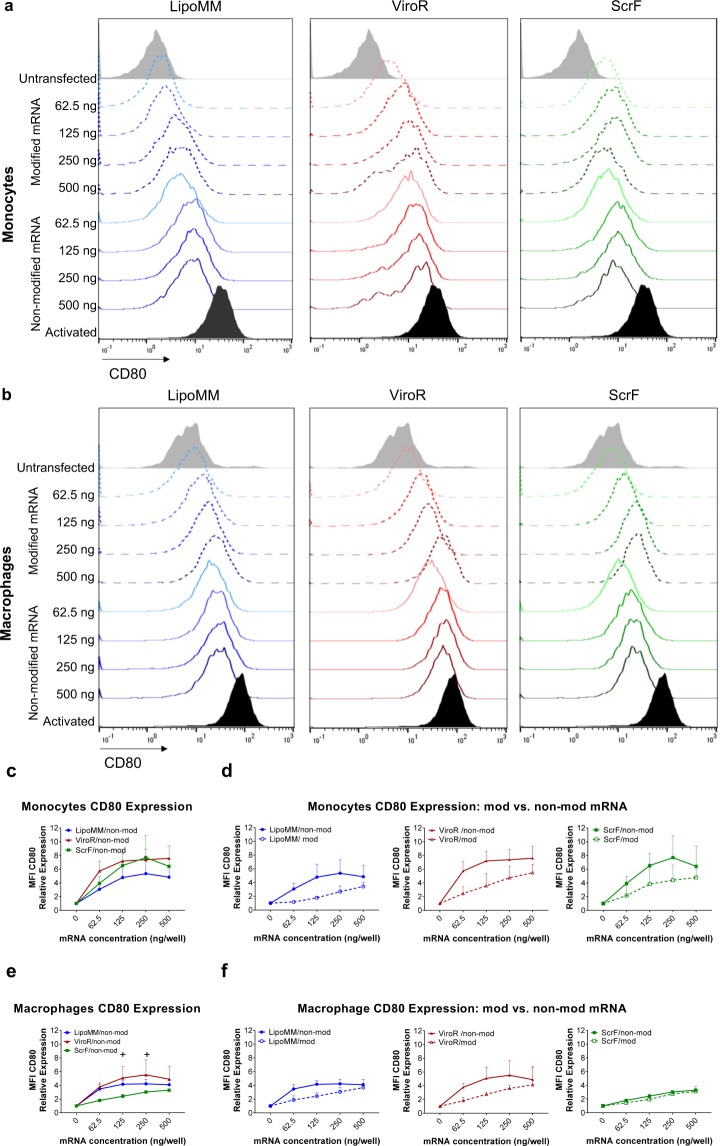
Figure 4.
Activation of monocytes and macrophages assessed via CD80 expression; Histograms of CD80 expression in (a) monocytes and (b) macrophages transfected with modified (dashed lines) and non-modified mRNA (solid line) using LipoMM, ViroR, and ScrF. (c) Mean fluorescent intensity (MFI) of CD80 normalized to untransfected cells in monocytes transfected with non-modified mRNA using three transfection reagents. CD80 expression in monocytes transfected with either modified or non-modified mRNA using LipoMM, ViroR, and ScrF (d). The same assessment performed for macrophages to compare activation caused by three transfection methods (e), or modified versus non-modified mRNA transfected by LipoMM, ViroR and ScrF (f). Values for no mRNA (0 ng/well) refer to untransfected cells throughout. “Activated” refers to cells treated with LPS (2 µg·mL−1) and IFN-γ (10 ng·mL−1) for 24 h. Statistical differences in activation levels are depicted with + for ViroR vs. ScrF. +p < 0.05, **p < 0.01, ***p < 0.001; Values are presented as mean ± SD, n = 3. Error bars indicate SD.

