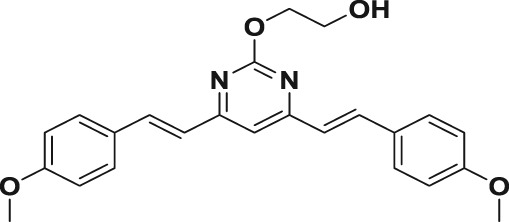
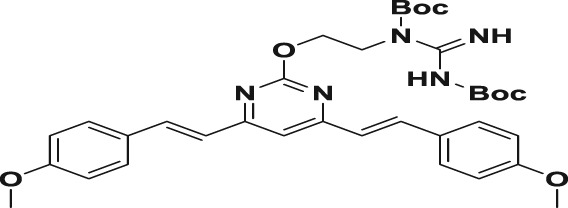
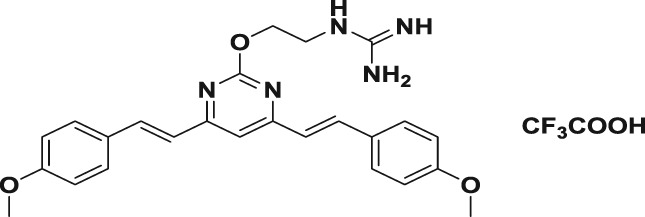
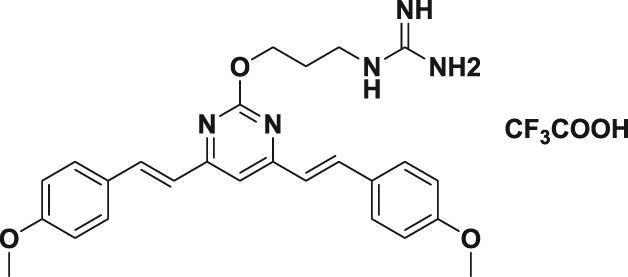
Table 1.
The cytotoxicity and anti‐HSV effects of compounds in vitro (CC50, IC50, and SI)
| Compound | Structure | CC50 (μM)a | IC50 (μM)b | SIc | ||
|---|---|---|---|---|---|---|
| HSV‐1 | HSV‐2 | HSV‐1 | HSV‐2 | |||
| 3a |
|
80.7 ± 1.7 | 365.9 ± 38.3 | 621.7 ± 18.2 | 0.2 | 0.1 |
| 4a |
|
118.2 ± 3.6 | 378.1 ± 19.3 | 528.7 ± 28.1 | 0.3 | 0.2 |
| 5a |
|
95.6 ± 2.6 | 2.2 ± 0.6 | 3.4 ± 0.3 | 43.5 | 28.1 |
| 5b |
|
69.6 ± 2.1 | 30.5 ± 1.2 | 37.4 ± 1.0 | 2.3 | 1.9 |
| 5c |
|
109.6 ± 3.8 | 62.1 ± 0.4 | 59.7 ± 2.1 | 1.8 | 1.8 |
| 5d |
|
119.9 ± 2.7 | 1.8 ± 0.1 | 2.2 ± 0.4 | 66.6 | 54.5 |
| 5e |
|
119.2 ± 1.4 | 5.4 ± 0.8 | 8.5 ± 0.9 | 22.1 | 14.0 |
| 5f |
|
111.0 ± 2.6 | 9.5 ± 1.8 | 10.8 ± 1.4 | 11.7 | 10.3 |
| Acyclovir | 459.5 ± 17.3 | 9.6 ± 0.8 | 12.5 ± 2.5 | 47.9 | 36.8 | |
Note. The inhibition effects on HSV‐1 (F strain) and HSV‐2 (333 strain; multiplicity of infection = 0.1) multiplication in Vero cells were evaluated by cytopathic effect inhibition assay. Results shown are means ± SD from five independent experiments.
Abbreviations: HSV, herpes simplex virus; SI, selectivity index.
Concentration required to reduce cell viability by 50% in Vero cells.
Concentration required to reduce the cytopathic effect of the virus by 50% at 24 hr p.i.
The ratio of CC50 to IC50 (SI = CC50/IC50).


