Figure 7.

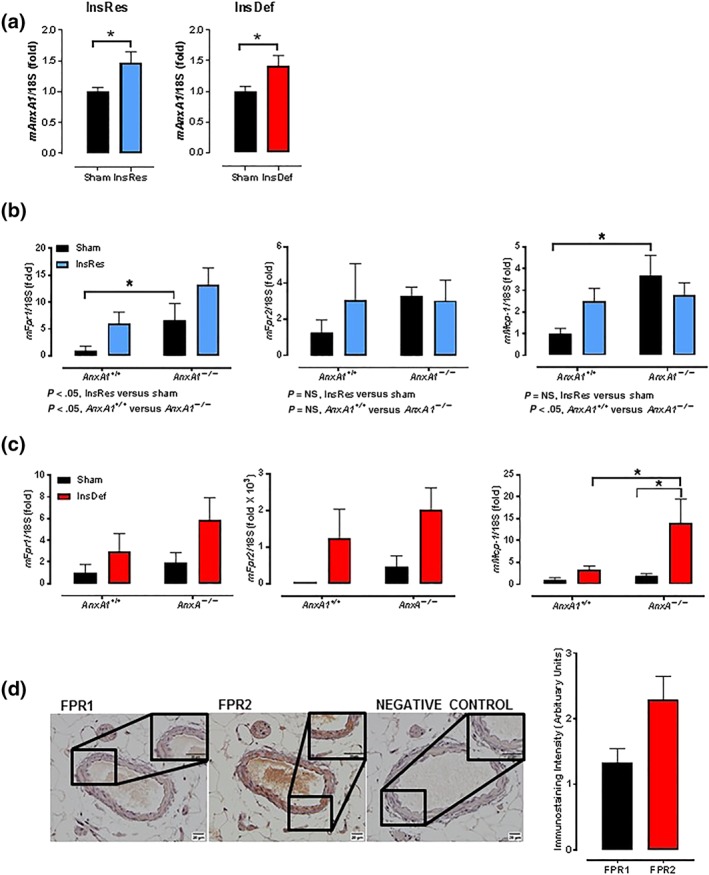
Expression and localisation of the AnxA1/FPR system in insulin‐resistant and insulin‐deficient mice. mAnxA1 (a), mFpr1, mFpr2, and mMCP‐1 mRNA expression in mesenteric arteries of insulin‐resistant (InsRes, b) and insulin‐deficient (InsDef, c) male mice. Sham AnxA1 +/+ and AnxA1 −/− (n = 6); insulin‐deficient AnxA1 +/+ and AnxA1 −/− (n = 6); insulin‐resistant AnxA1 +/+ and AnxA1 −/− (n = 6) male mice. Localisation (representative image) and quantification of FPRs in mesenteric arteries (d, n = 5–7). Insert highlights a region within the blood vessel (magnification ×100). VSMCs, vascular smooth muscle cells; EC, endothelial cell; mFpr1, formyl peptide receptor 1 gene; mFpr2, formyl peptide receptor 2 gene; FPR1, formyl peptide receptor 1 protein; FPR2, formyl peptide receptor 2 protein. Values are mean ± SEM. An outlier in insulin‐deficient AnxA1 −/− mice is predefined when an individual data point is 2 SDs away from the mean. *P<0.05, significantly different as indicated. (a) was analysed using unpaired Student's t test, (b) and (c) were analysed using repeated‐measures two‐way ANOVA with Bonferroni post hoc analysis
