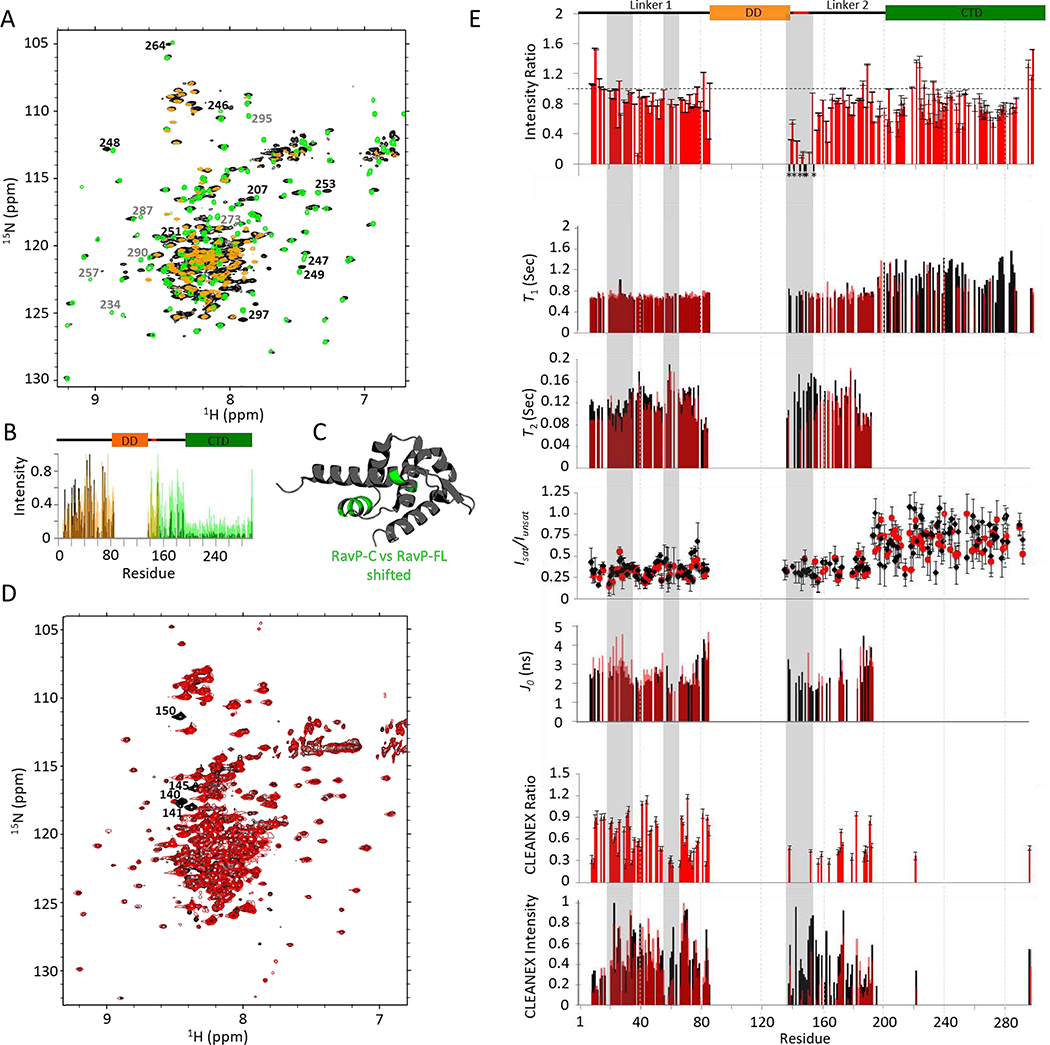
Fig. 3. RavP NMR relaxation experiments.
(A) 1H-15N TROSY-HSQC spectral overlay of RavP-FL (black) with RavP-C (green) and RavP-N (orange) demonstrating the strong agreement in chemical shifts between the constructs and the full-length protein. Peaks that shift between RavP-FL and RavP-C spectra are labelled in black, and peaks that disappear or decrease in intensity are labeled in grey. Normalized intensities for all three proteins are shown with the domain architecture in (B). (C) Crystal structure for the RavP CTD (PDB 1VYI) highlighting residues with peaks that shift in HSQCs for RavP-C and RavP-FL (green). (D) BEST 1H-15N TROSY-HSQC for free (black) and LC8 bound (red) RavP-FL collected at 800 MHz. Example peaks showing large attenuations in peak intensity are labelled. (E, Top) Ratios of Bound:Free peak intensities, generated using the spectra shown in (D). Error bars were calculated using the intensities of the baseline noise. Peaks that disappear in the bound sample in (D) are marked by an *, and are localized to the LC8 site. Relaxation times (T1, and T2) for free (black) and bound (red) are shown overlaid on the same axis, as are J0 values from the spectral density analysis. Residues with fit errors greater than 25% of their value are not shown. HSQC-based 1H-15N NOEs (Isat/Iunsat) demonstrate the difference between linker and CTD residues. The CLEANEX intensities (E, Bottom) for free and bound RavP show regional differences, and were compared as a CLEANEX ratio (bound:free) in the graph above. Note that LC8 interactions lead to decreased CLEANEX intensities from residues 55–70, and across the majority of Linker 2. The segments most changed by LC8-binding are highlighted in grey.

