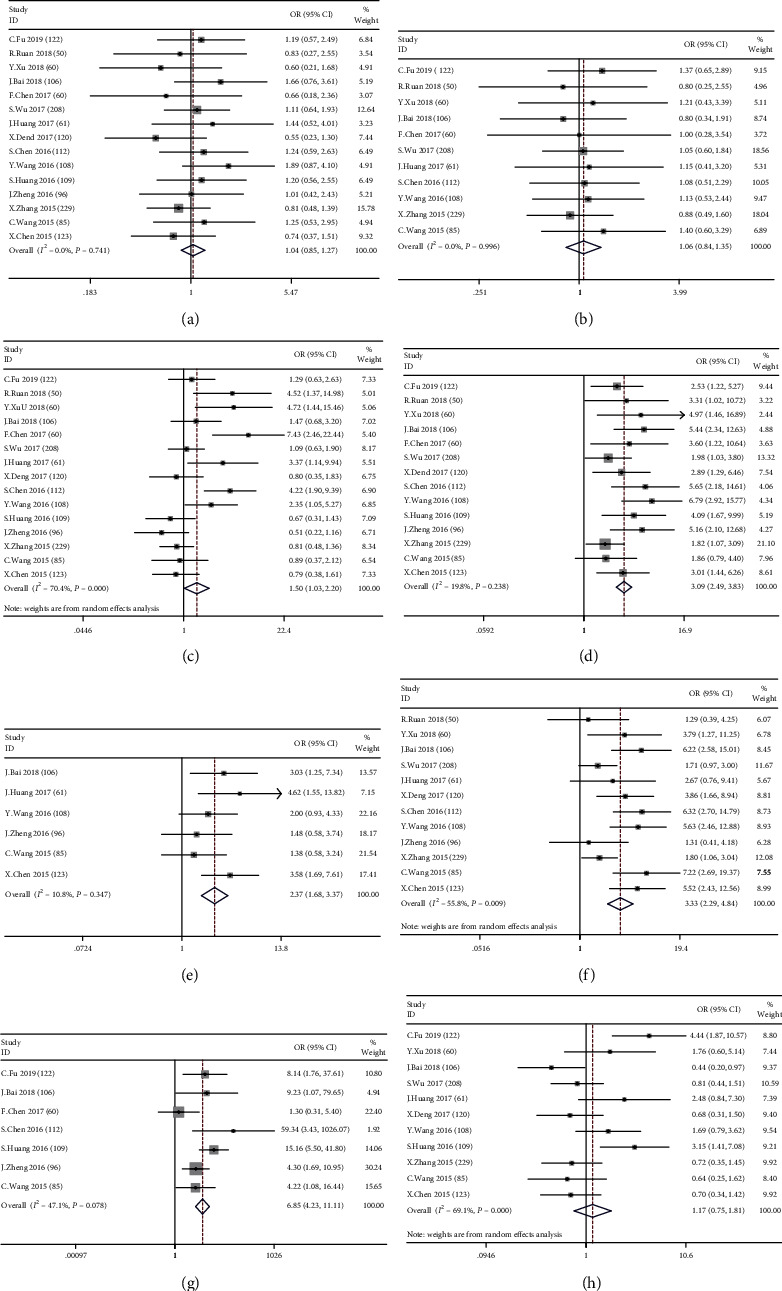
Figure 2.

Meta-analysis estimating the correlation between CCAT2 and clinicopathological parameters in cancer patients: (a) Age (P′ = 0.741, fixed effects model); (b) gender (P′ = 0.996, fixed effects model); (c) tumor size (P′ < 0.001, random effects model); (d) clinical stage (P′ = 0.238, fixed effects model); (e) T (P′ = 0.347, fixed effects model); (f) N (P′ = 0.009, random effects model); (g) M (P′ = 0.078, fixed effects model); (h) differentiation (P′ < 0.001, random effects model).
