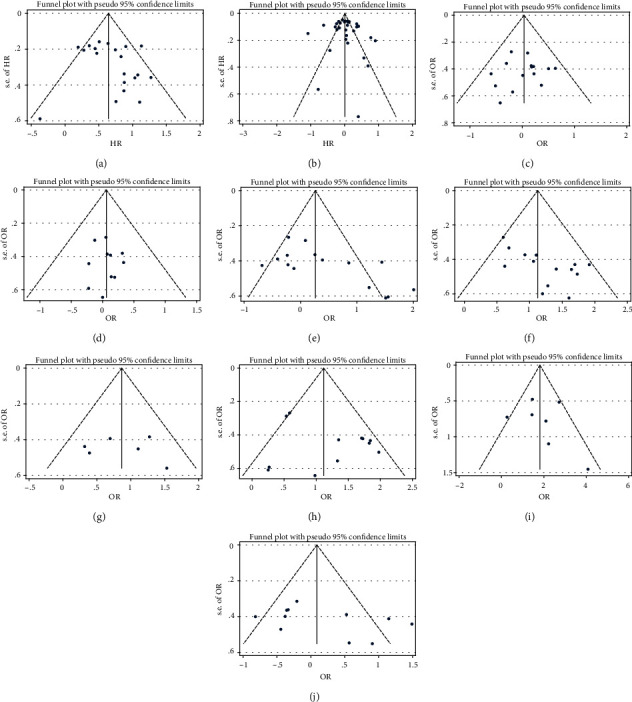
Figure 4.

Funnel plots (Begg's method) of potential publication bias in the selected studies. (a) OS of study patients (Pr = 0.496); (b) OS in TCGA data (Pr = 0.455); (c) age (Pr = 0.921); (d) gender (Pr = 1.000); (e) tumor size (Pr = 0.038); (f) clinical stage (Pr = 0.050); (g) T (Pr = 1.000); (h) N (Pr = 0.837); (i) M (Pr = 0.548); (j) differentiation (Pr = 0.213).
