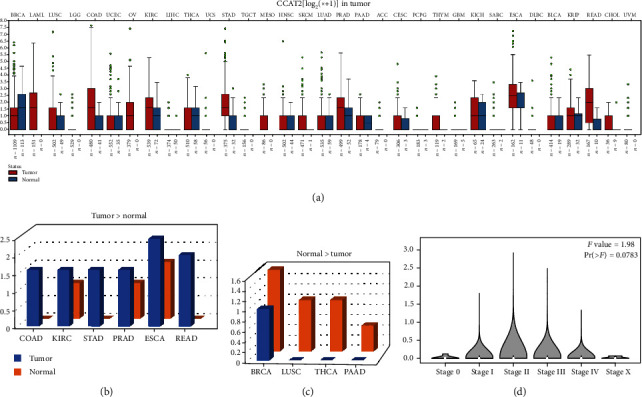
Figure 5.

CCAT2 expression profile across tumor samples and adjacent normal tissues from TCGA; log2(TPM + 1) scale. (a) The level of CCAT2 expression of all types of tumors is shown, box plot. (b) The level of CCAT2 expression was higher in the tumor than in adjacent normal tissue (COAD/KIRC/STAD/PRAD/ESCA/READ), bar plot. (c) The level of CCAT2 expression was lower in the tumor than in adjacent normal tissue (BRCA/LUSC/THCA/PAAD), bar plot. (d) The pathological stage plot of CCAT2 from GEPIA. ∗The height of the bar represents the median expression of specific tumor types or normal tissues.
