
Figure 4.
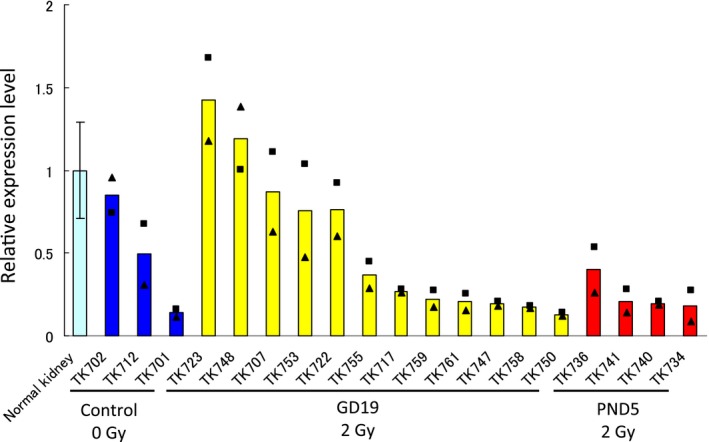
Quantitative RT‐PCR assessment of Tsc2 expression in normal rat kidney tissues, spontaneous renal tumors and radiation‐associated renal tumors. The data for normal kidney tissues (the mean ± SD of 6 samples) and for renal tumors (the average of two independent experiments, ■ and ▲) are shown. The data for tumors were normalized to the average expression value for normal kidney tissues