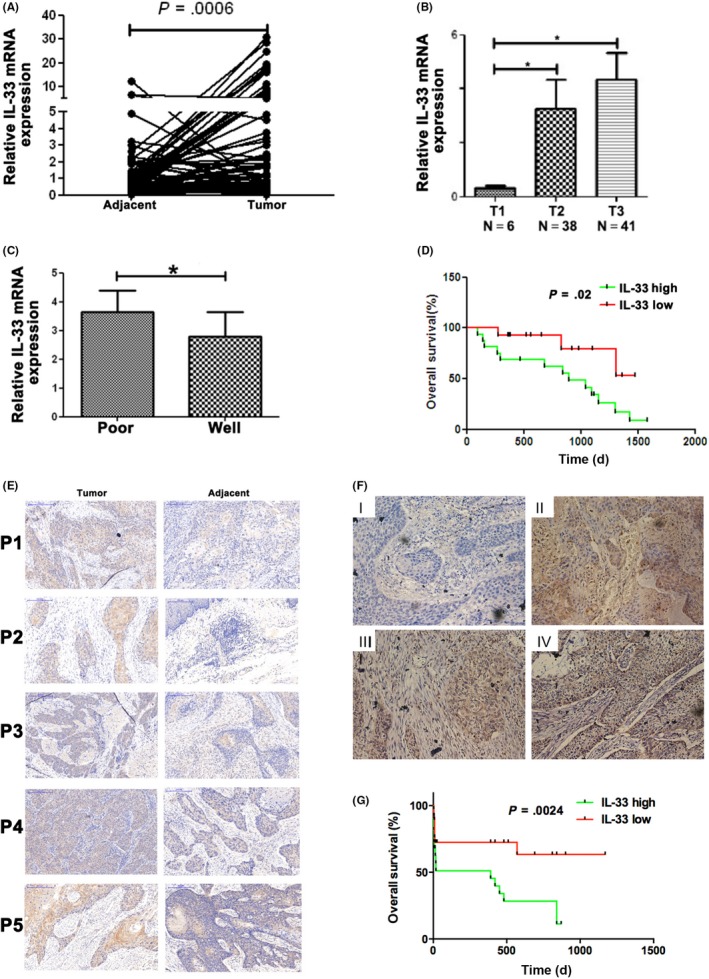
Figure 1.

A,B, RT‐PCR analysis of interleukin (IL)‐33 mRNA expression in esophageal squamous cell carcinoma (ESCC) and paired noncancerous tissues (n = 87). C, RT‐PCR analysis of IL‐33 mRNA expression in poor and well differentiated tissues. D, Overall survival in ESCC patients with IL‐33‐low and IL‐33‐high mRNA expression. E, Representative images of immunohistochemical (IHC) staining for IL‐33 in ESCC tissues and adjacent normal tissues. F, Representative images of IHC staining for IL‐33 in different stages. G, Overall survival in ESCC patients with IL‐33‐low and IL‐33‐high protein expression. Mean ± SD of relative fold changes from triplicate experiments was plotted
