
Figure 2.
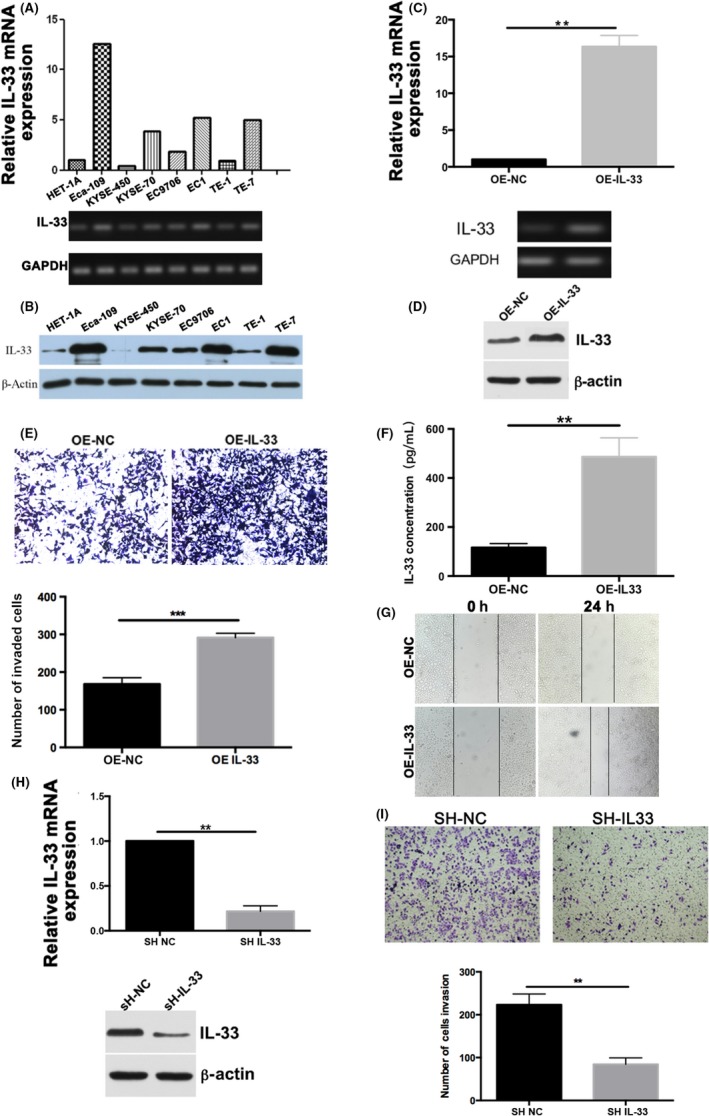
A, RT‐PCR analysis of interleukin (IL)‐33 expression in HET‐1A, Eca‐109, KYSE‐450, KYSE‐70, EC9706, EC9706 clone EC1, TE‐1, and TE‐7 cell lines. B, Western blot analysis for IL‐33 expression in esophageal squamous cell carcinoma (ESCC) cell lines. C,D, RT‐PCR and western blot analysis for IL‐33 overexpression (OE) in KYSE‐450 cells. E, Migratory and invasive capabilities of KYSE‐450 cells were evaluated using migration and invasion assays. F, ELISA analysis for IL‐33 overexpression in KYSE‐450 cells. G, Scratch healing was photographed under a microscope after 0 and 24 h. H, RT‐PCR and western blot analysis to detect the efficiency of IL‐33 knockdown in Eca‐109 cells. I, Transwell assay for ESCC cells with knockdown of IL‐33. Relative fold changes from triplicate experiments are plotted. NC, control