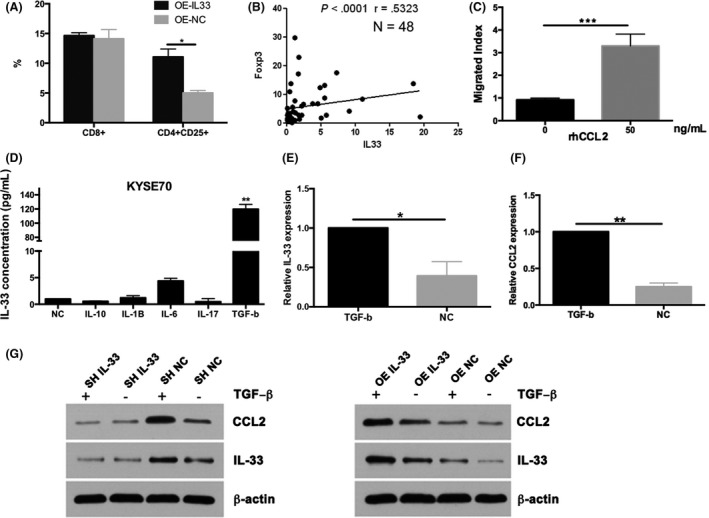
Figure 4.

A, Transwell assays to detect the proportion of regulatory T cells (Tregs) with overexpression (OE) of interleukin (IL)‐33. B, Chemotactic effect of CCL2 to Tregs in 48 patients with esophageal squamous cell carcinoma by RT‐PCR and flow cytometry. C, Migrated index for addition of recombinant protein CCL2. D, ELISA analysis for IL‐33 with increased transforming growth factor‐β (TGF‐β) level. E,F, RT‐PCR for IL‐33 and CCL2 with addition of TGF‐β. G, Western blot analysis to observe the association between CCL2 and TGF‐β with IL‐33 overexpression or knockdown. Data are presented as mean ± SD
