
Figure 6.
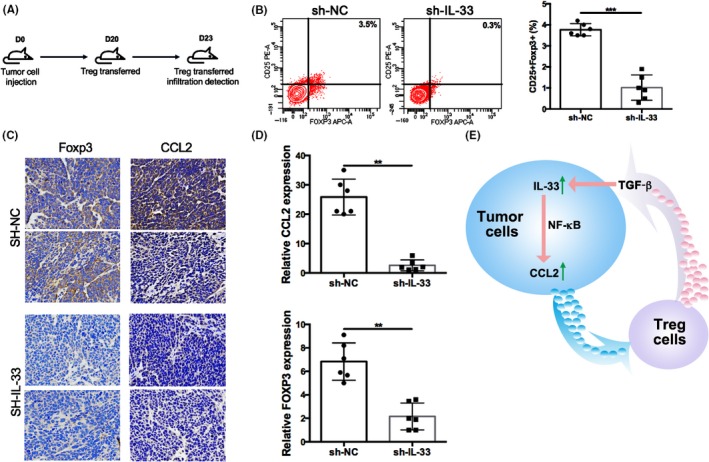
A, Esophageal squamous cell carcinoma tumor cell injection into nude mice (n = 5). D, day. B, Flow cytometry analysis shows the proportion of regulatory T cells (Tregs) in the shIL‐33 group and control group (NC). C, Immunohistochemical staining to detect the expression of Foxp3 and CCL2. D, RT‐PCR for Foxp3 and CCL2 with knockdown of interleukin (IL)‐33. E, Schema showing molecular mechanisms. Data are presented as mean ± SD