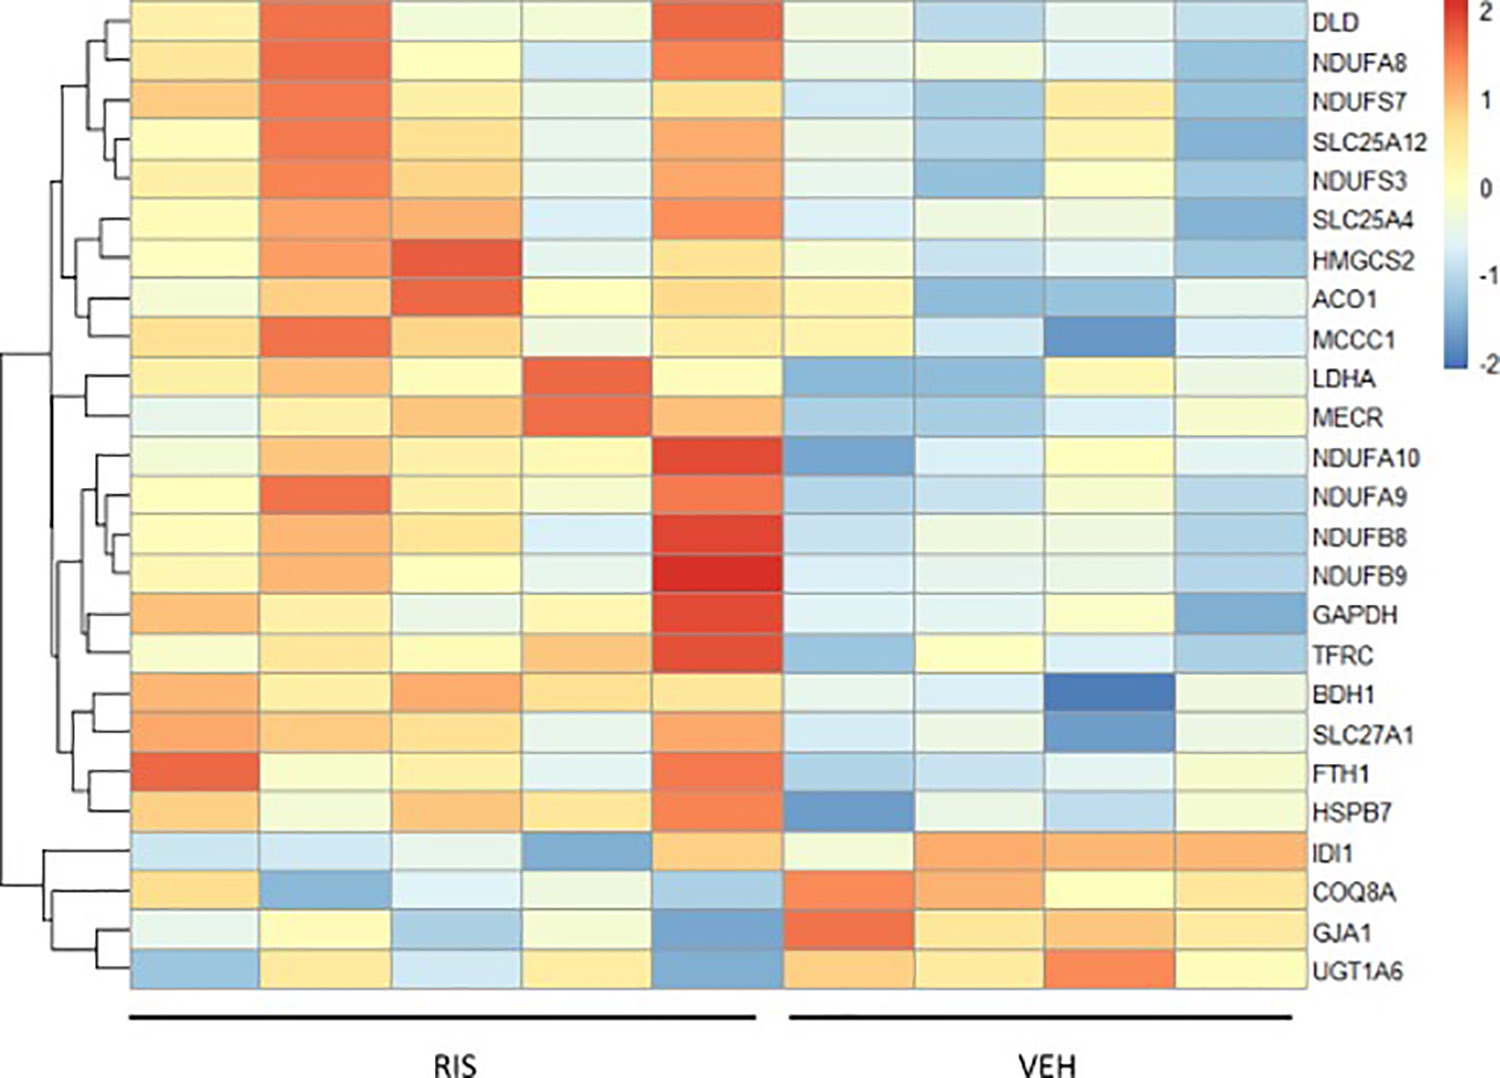
Figure 1. Heat map of differential changes in mitochondrial protein expression in RIS and VEH hearts.

Each mitochondrial protein level is normalized to the mean of the protein across all male mouse heart samples. Red shows samples above mean protein expression and blue is below mean protein expression. (VEH/RIS n=4/n=5)
