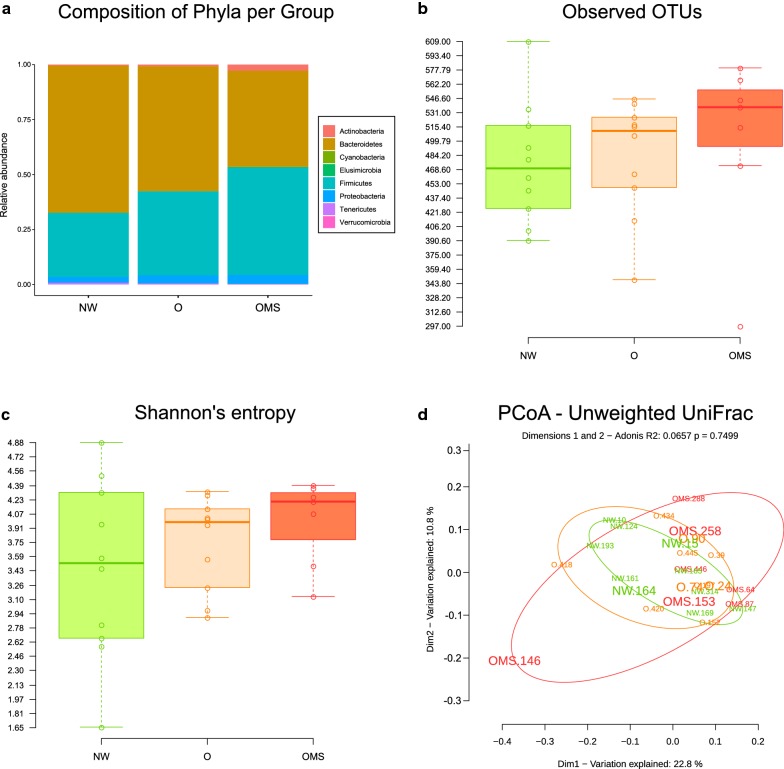
Fig. 1.
Analysis of the 16S rRNA gene profiles. Each panel compares the NW, O, and OMS groups. a Mean Relative abundance of the phyla present in each group. b Mean observed OTUs per sample and group. The averaged total unique OTUs from 10,000 rarefactions per sample are shown as points with overlying boxplots showing the distribution within each group. c Mean Shannon’s entropy per sample and group. The averaged Shannon’s index value from 10,000 rarefactions per sample are shown as points with overlying boxplots showing the distribution within each group. d Principal coordinate analyses of Unweighted UniFrac distances. Elipses were calculated based on the most distant samples per group. Samples for which RNA-seq information is available are presented with a larger font

