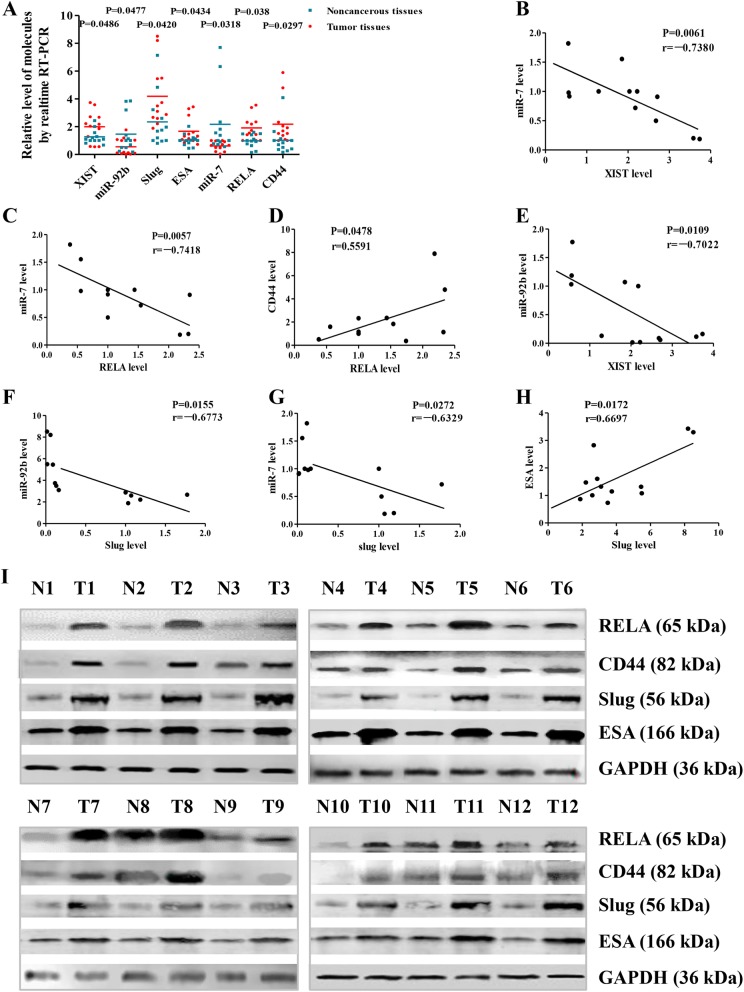
Fig. 1.
Detection of miR-7 and BCSC-related molecular expression. a Expression of miR-7, XIST, miR-92b, RELA, CD44, Slug, and ESA in breast cancer postsurgery samples analyzed by RT-qPCR. b–h Relative expression levels of miR-7 and XIST, miR-7 and RELA, miR-7 and Slug, miR-92b and XIST, miR-92b and Slug, RELA and CD44, and ESA and Slug in that order. i Relative expression levels of RELA, CD44, Slug, and ESA analyzed by Western blotting. All the data represent the mean ± S.D. (n = 12). Blue points represent adjacent noncancerous tissues; red points represent tumor tissues. N noncancerous tissues, T tumor tissues

