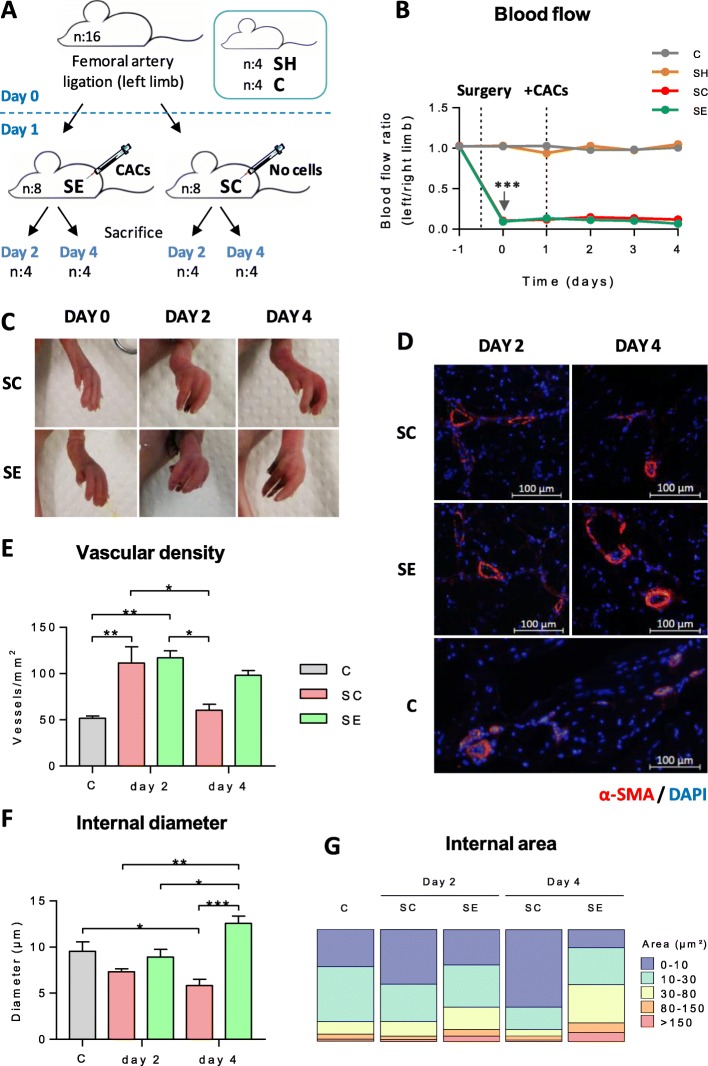
Fig. 1.
CLI progression, blood flow changes, and vasculogenesis in ischemic vs CAC-treated mice. a Schematic representation of experimental mice distribution. b Blow flow evolution per group (C, SH, SC, and SE) within time. Averaged ratios of the left (injured) vs right (non-injured) limbs are shown. c Representative images of ischemic symptoms (inflammation, necrotic fingers) in SE and SC mice. d IHC images to measure vascular density and diameter size, using anti-mouse smooth muscle α-actin (red) and DAPI (blue). e The number of vessels (vessels/mm2) and f diameter size (μm) were calculated in SE and SC groups vs C (healthy controls). g Vessel classification based on abundance percentage of different ranges of internal lumen areas (μm2). Groups analyzed: C: healthy control (n:4); SH: sham, surgery controls (n:4); SC: ischemic mice, no cell treatment (n:4); SE: ischemic mice, CAC treatment (day 2, n:4 and day 4, n:3). Data were presented as mean ± SEM. Significant differences were seen by two-way ANOVA (b) and one-way ANOVA (e, f) and Tukey post hoc in all cases. *p value < 0.05, **p value < 0.01, ***p value < 0.001

