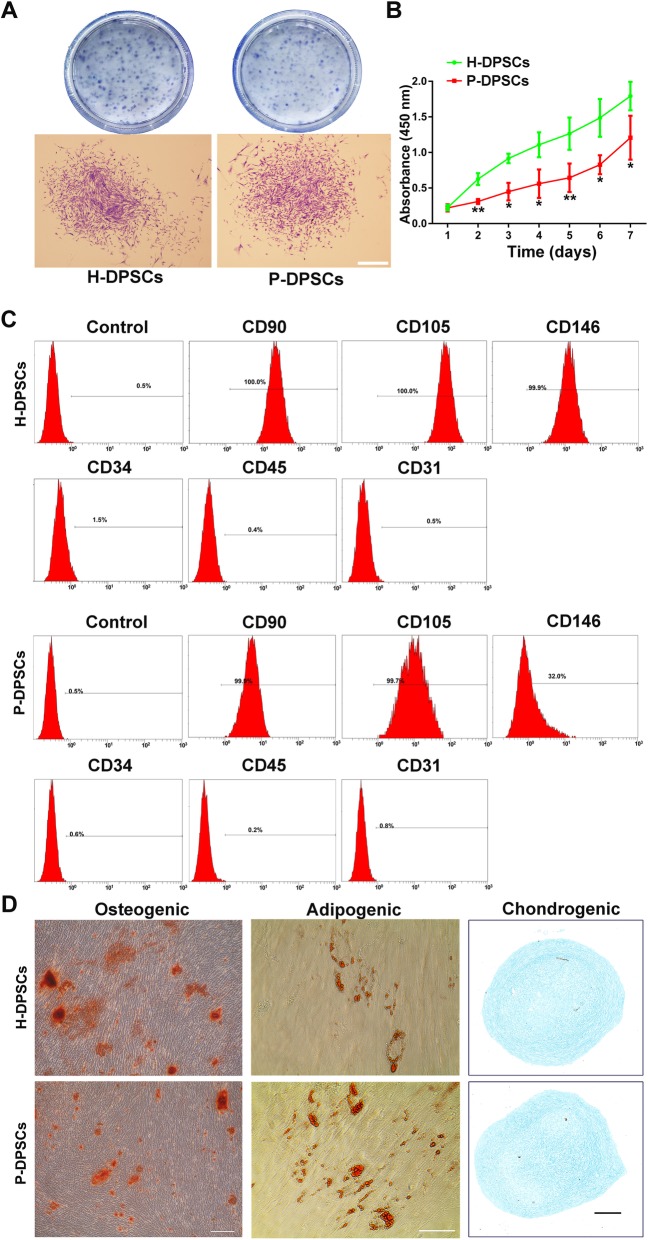
Fig. 1.
Isolation and identification of H-DPSCs and P-DPSCs. a Representative images of colony units in a general view (first row of images) and a single colony of H-DPSCs and P-DPSCs observed by microscopy (second row of images; scale bar, 200 μm). b Proliferative activity of H-DPSCs and P-DPSCs evaluated by CCK-8 assay (n = 3; *P < 0.05, **P < 0.01 vs. the H-DPSC group). c Surface markers of H-DPSCs and P-DPSCs assayed by flow cytometry. d Multiple differentiation potentials of H-DPSCs and P-DPSCs: Alizarin Red S staining for osteogenic differentiation (left; scale bar, 200 μm), Oil Red O staining for adipogenic differentiation (middle; scale bar, 200 μm), and Alcian blue staining for chondrogenic differentiation (right; scale bar, 200 μm)

