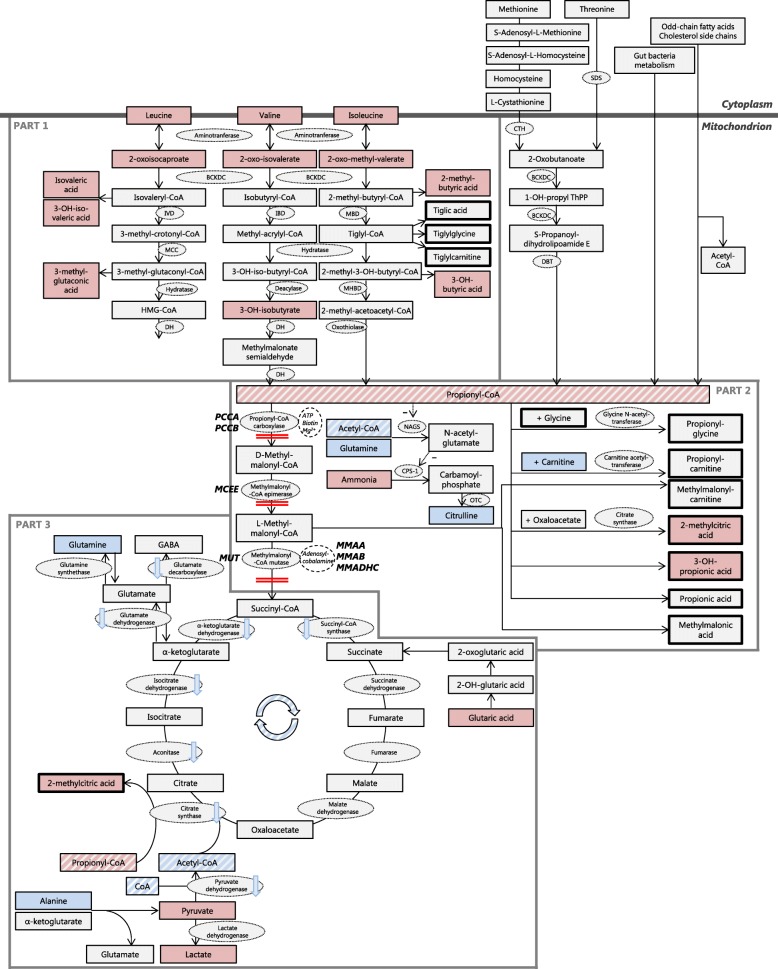
Fig. 1.
Alterations of the propionate pathway in times of acute metabolic decompensation. Metabolites are depicted in rectangles. Metabolites with significantly increased values during acute metabolic decompensations (AMD) are depicted in red, metabolites with normal values during AMD are depicted in light grey and metabolites with significantly decreased values during AMD are depicted in blue. The potential blockages of the pathway, due to enzyme deficiencies in PA and MMA, are depicted by double red lines. Genes involved in PA and MMA are depicted in bold capitals. Propionyl-CoA and acetyl-CoA, central metabolites in the pathway, are highlighted by diagonal stripes. Enzymes are depicted in light grey ovals, cofactors are depicted in white ovals. Decreased activity of enzymes is depicted by light blue arrows. The pathway is distinguished in three parts, indicated by dark gray lines. Cytoplasm is distinguished from the mitochondrion, indicated by a broad dark gray line. Abbreviations: BCKDC: branched-chain α- ketoacid dehydrogenase complex. CPS-1: carbamoyl phosphate synthase I. CTH: cystathionine gamma-lyase. DBT: dihydrolipoamide branched chain transacylase E2. DH: dehydrogenase. IBD: isobutyryl-CoA dehydrogenase. IVD: isovaleryl-CoA dehydrogenase. MBD: 2-methylbutyryl-CoA dehydrogenase. MCC: 3-methylcrotonyl-CoA carboxylase. MHBD: 2-methyl-3-hydroxy-butyryl-CoA dehydrogenase. NAGS: N-acetylglutamate synthase. OTC: ornithine transcarbamylase. SDS: L-serine dehydratase

