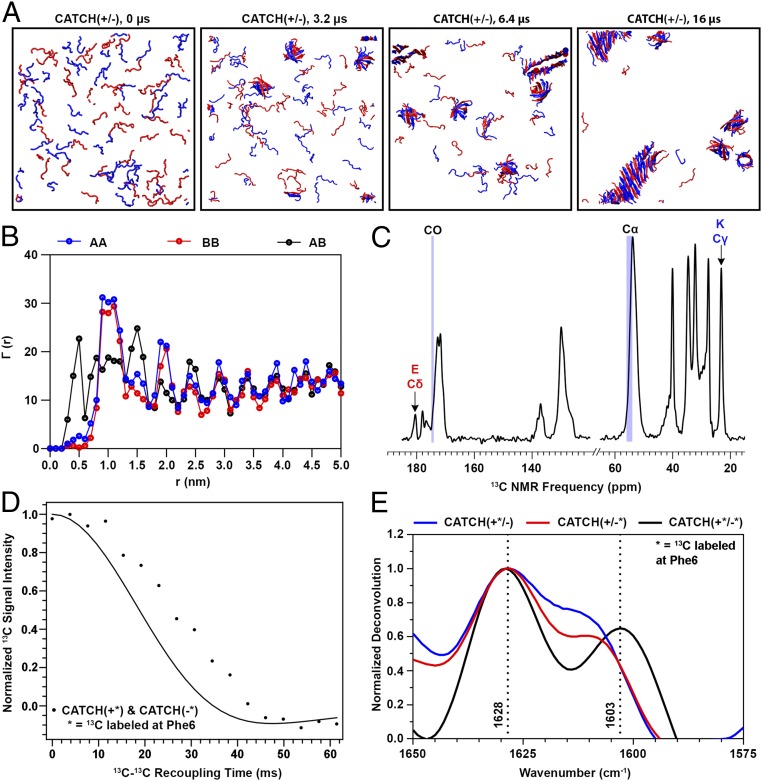
Fig. 1.
Computational simulations and biophysical measurements of an equimolar CATCH(+) and CATCH(−) mixture show coassembly. (A) DMD/PRIME20 simulations of a mixture of 48 CATCH(+) and 48 CATCH(−) peptides at 20 mM concentration. Snapshots at 0, 3.2, 6.4, and 16 μs are presented. (B) , , and , defined in the text as computationally predicted average numbers of A or B central atoms as a function of distance r from central atoms within peptide A or B. (C) The 1H-13C CPMAS spectra of a CATCH(+/−) nanofiber sample. (D) PITHIRDS-CT decay curve of a CATCH nanofiber sample 13C-labeled on both CATCH(+) and CATCH(−) on the carbonyl C of Phe6. The solid black curve corresponds to the predicted signal decay in the PITHIRDS-CT experiment from a nuclear spin simulation of eight 13C atoms along an ideal coassembled antiparallel β-sheet. (E) FTIR spectra of equimolar mixtures of labeled CATCH(+) and CATCH(−) (black), labeled CATCH(+) and unlabeled CATCH(−) (blue), and unlabeled CATCH(+) and labeled CATCH(−) (red) at 10 mM in 1× phosphate-buffered saline. The dashed lines identify the wavenumbers corresponding to the location of the peaks in the black spectrum.

