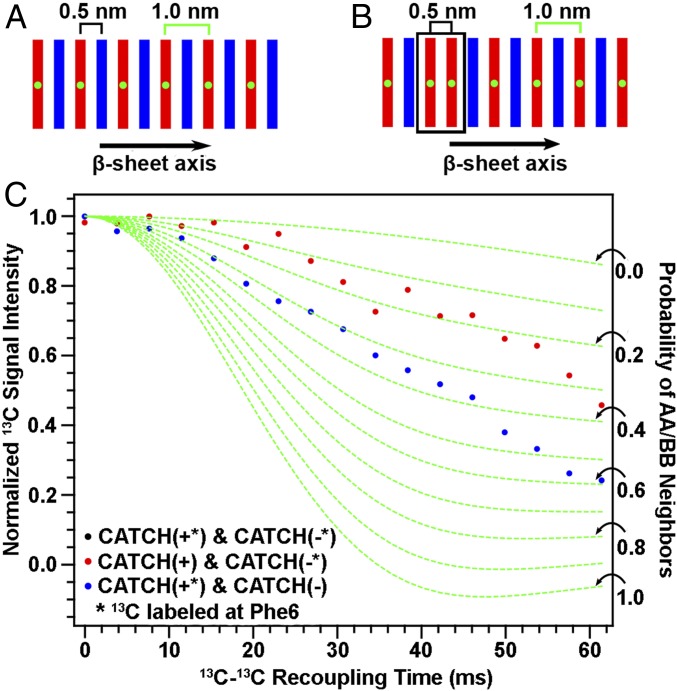
Fig. 5.
Evaluating the propensity for CATCH(+) and CATCH(−) to self-associate. (A and B) Schematics of possible peptide organization within the nanofiber; green dots represent 13C labeling. (C) Isotopic dilution PITHIRDS-CT measurements of coassembled CATCH(+/−) nanofibers where only one peptide is 13C-labeled at a time. The asterisks in the plot legend indicate which peptide was isotopically labeled with 13C at the central atom. The dashed green curves correspond to simulations that account for the probabilities of like-neighbors for the 13C-labeled peptide as indicated by black arrows along the right vertical axis. Details describing these simulations can be found in SI Appendix.

