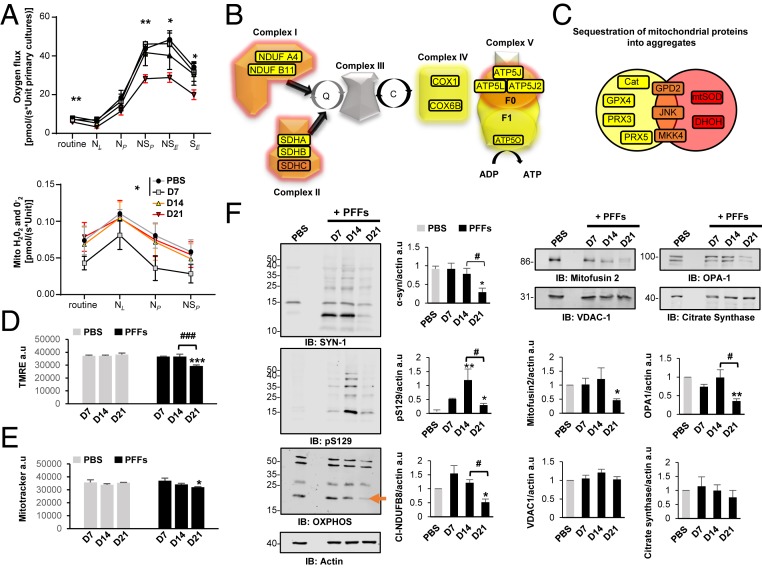
Fig. 6.
Dynamics of Lewy body formation and maturation induce mitochondrial alterations. (A) High-resolution respirometry measurements. Statistical results were obtained from two-way repeated measurement ANOVAs based on a minimum of four independent experiments. (B and C) Proteomic data on proteins implicated in mitochondrial dysfunction. (D) Mitochondrial membrane potential was assessed fluorometrically from cells loaded with TMRE. (E) Measurement of mitotracker green level, which labels mitochondrial proteins independently of mitochondrial membrane potential. (F) Western blot analyses of total fractions immunoblotted with antibodies against components of the OXPHOS complexes I-V, mitofusin 2, OPA1, citrate synthase, and VDAC1 proteins. Actin was used as the loading control. The graphs (D–F), represent the mean ± SD of a minimum of three independent experiments. *P < 0.05, **P < 0.005, ***P < 0.0005 (ANOVA followed by Tukey honest significant difference [HSD] post hoc test, PBS- vs. PFF-treated neurons). #P < 0.05, ###P < 0.0005 (D14 vs. D21 PFF-treated neurons). a.u., arbitrary unit.

