Fig. 4.
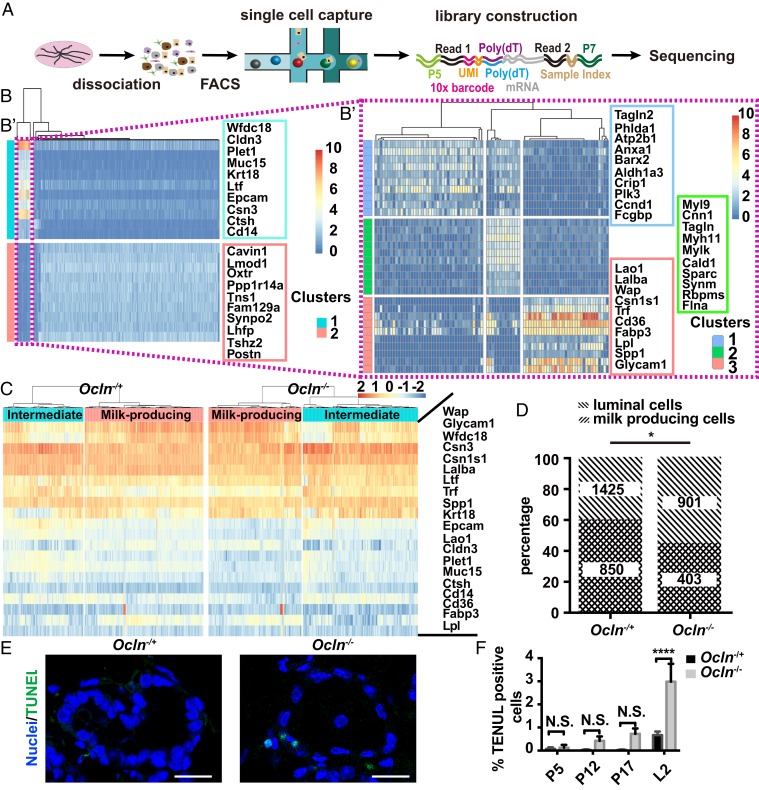
Ocln-deficient mammary glands had a below-normal percentage of MPCs, due in part to an increase in apoptosis. (A) Diagram depicting the experimental procedures of single-cell analyses of Ocln−/+ and Ocln−/− mammary glands to determine the percentage of MPCs in these glands. (B and B′) Identification of marker genes of MPCs using published single-cell transcriptomics (35). (B) Heat map of epithelial subtypes and their gene expression levels during lactation. (B′) Luminal cells during lactation were further analyzed and divided into subtypes. The milk-producing subtype was identified along with their 20 most highly expressed marker genes. (C and D) Subtyping of luminal epithelial cells using these 20 MPC marker genes to identify the percentages of MPCs in Ocln−/+ and Ocln−/− mice (C). Percentages of MPCs among all luminal cells in Ocln−/+ and Ocln−/− mice (D). The two-sided χ2 test was performed for statistical analysis. (E and F) Cell death as detected by TUNEL staining (green) at the P5, P10, P17, and L2 stages (E) and as quantified (F). No statistically significant differences were detected at the times indicated (unpaired two-tailed Student’s t test). (Scale bars: 20 µm.) N.S. ≥ 0.05; *P < 0.05; ****P < 0.0001.

