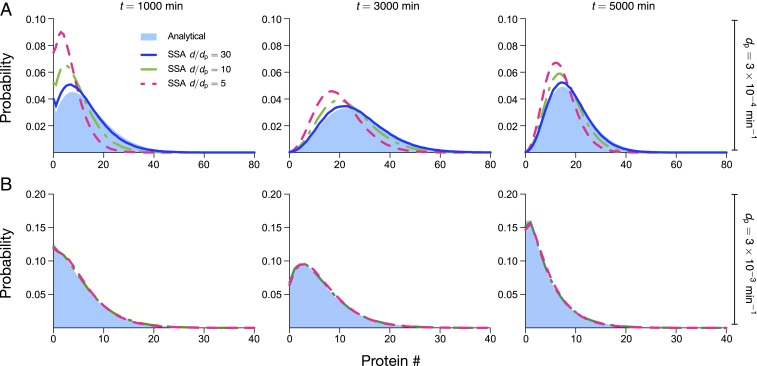
Fig. 5.
Comparison of protein distributions predicted by theory (under the assumption of slow protein dynamics) and stochastic simulations using the SSA. (A) Using parameters typical of mammalian cells, we find that our theory agrees well with simulations for , is acceptable for , and performs poorly for ; agreement tends to be better with increasing time, but accuracy is mostly determined by . Note that the protein lifetime is ln 2/dp = 2,310 min, the cell-cycle duration is td = 1,560 min, and the mRNA lifetime is , 231, and 77 min for , respectively. Given the value of , we have that t = 1,000; 3,000; 5,000 min corresponds to cells in generations one, two, and three, respectively. (B) Parameter values as in A, except that the protein, mRNA decay, and translation rates are multiplied by 10. Note that the ratio is unchanged from A, but both protein and mRNA lifetimes are now 10 times smaller, meaning that they are significantly less than the cell-cycle time. This condition leads to significantly improved agreement between theory and simulations, such that they are indistinguishable for . See SI Appendix, section 12 for the choice of parameters.

