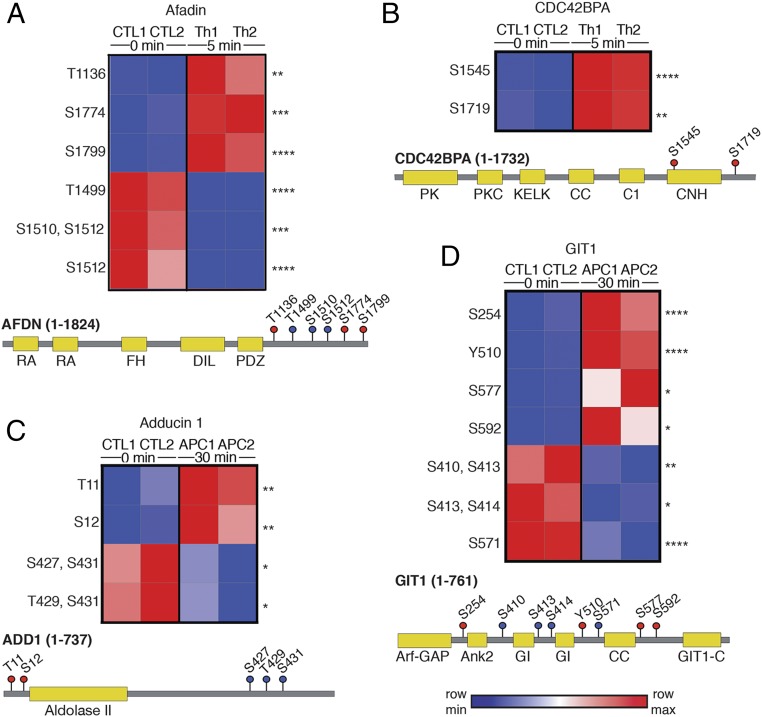
Fig. 4.
Heat maps and diagrams of proteins phosphorylated by Th (A) afadin and (B) CDC42BPA or by APC (C) adducin-1 and (D) GIT1. Increases and decreases in phosphorylation sites are indicated by red and blue color intensities, respectively. Statistical significance was determined by two-way ANOVA (*P < 0.05, **P < 0.01, ***P < 0.005, ****P < 0.001). Cartoon diagrams show the protein domain structure and phosphorylation site location; red and blue dots with residue numbers indicate increases and decreases in phosphorylation, respectively. Color intensity is indicative of the extent of phosphorylation. All sites are conserved across human, mouse, and rat species.

