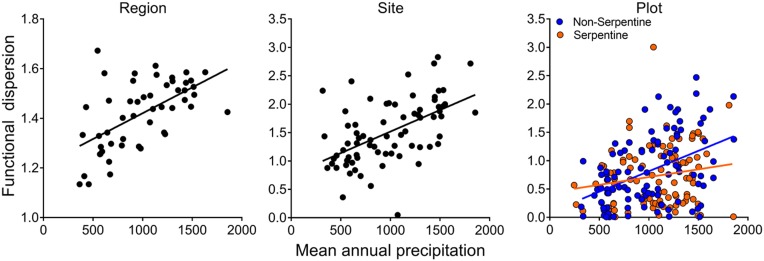
Fig. 4.
Functional diversity (dispersion) of woody plants versus mean annual rainfall at the regional scale (P = 0.0001), site (P < 0.0001), and plot scale (rainfall P = 0.0001, soil type P = 0.001, interaction P = 0.02). Similar relationships (not shown) were found for functional diversity versus NDVI at the regional (P < 0.0001), site (P = 0.0001), and plot scale (NDVI P < 0.0001, soil type P = 0.36, interaction P = 0.20). Sites or plots with only one woody species (4 of 78 sites, 32 of 224 plots) were excluded from these analyses.

