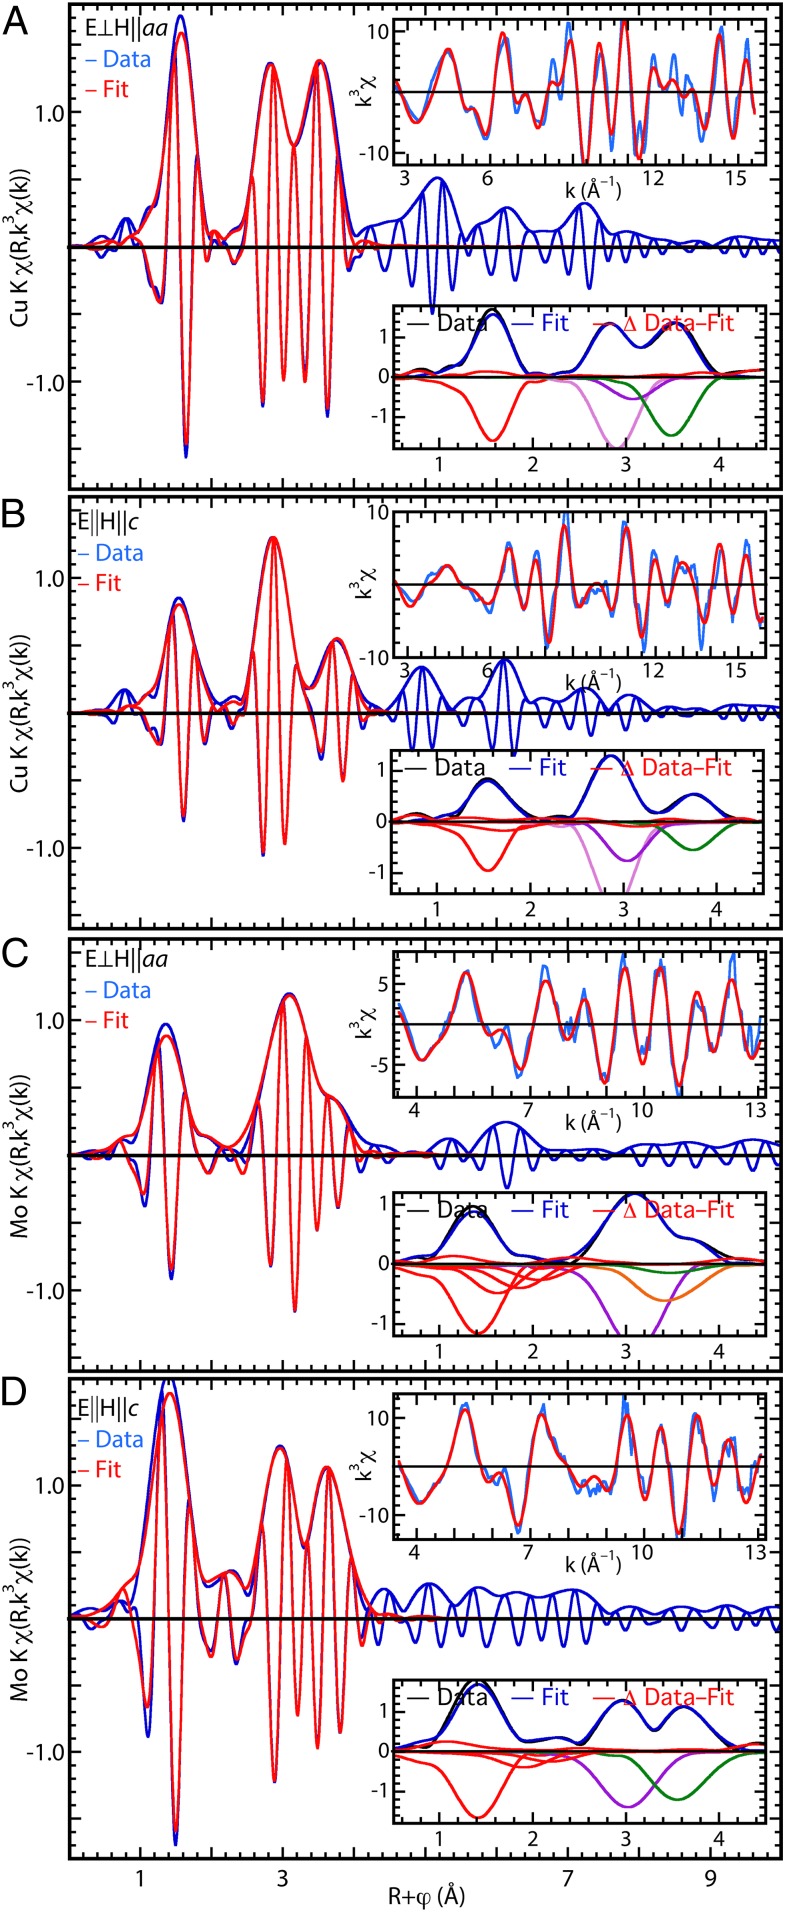
Fig. 3.
EXAFS [FT or χ(R) representation] of YSCO–Mo. (A) For Cu measured in the aa plane, the main graph shows the data and fit in real space, Upper Right Inset shows the same in k, and Lower Right Inset shows the FT moduli of the data, fits, and differences in their upper halves and the contributions of the individual neighbor shells, inverted for clarity, in their lower halves with red, O; violet, Y; purple, Sr; green, Cu; and orange, Mo. The relative numbers of atoms are reflected by the peak amplitudes, reduced by 1/R2 and the Debye–Waller factor. (B) The same as A, but for Cu measured in the c direction. (C) The same as A, but for Mo measured in the aa plane. (D) The same as B for Mo in the c direction.

