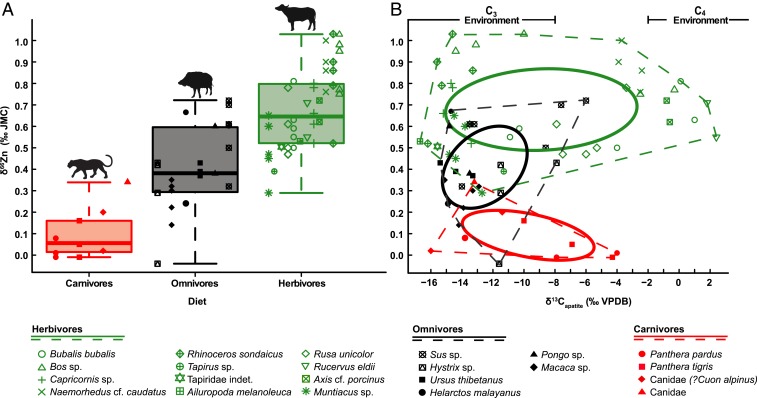
Fig. 1.
(A) Range of δ66Zn values (relative to the JMC-Lyon Zn isotope standard; ref. 74) in tooth enamel for carnivores (red), omnivores (black), and herbivores (green) of the THM cave assemblage. The boxes from the box and whisker plots represent the 25th–75th percentiles, with the median as a bold horizontal line. (B) Distribution of enamel δ66Zn versus δ13Capatite values of the THM cave assemblage (SI Appendix, Table S3), where “C3 environment” and “C4 environment” are, respectively, defined by δ13Capatite < −8‰ and > −2‰. Dashed lines represent the full range of variation and full lines represent 40% predictive ellipses (using R statistical software and package “SIBER”; refs. 72 and 75).

