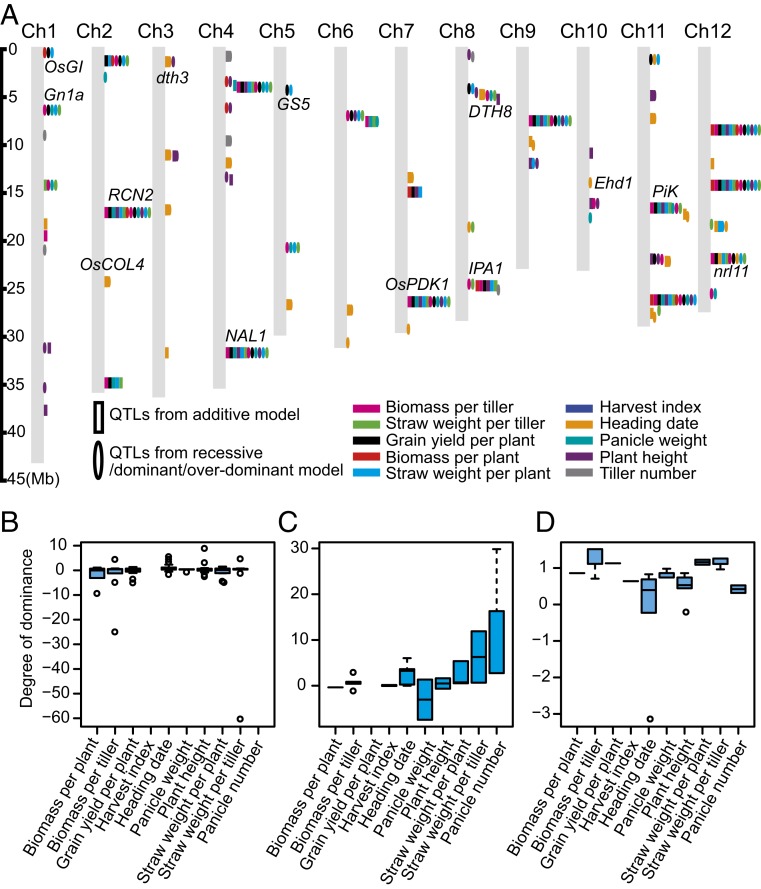
Fig. 1.
A genomewide association study was used to identify potential heterotic loci in the hybrids. (A) Chromosomal distribution of heterotic loci identified in the 2014CS trial. Ellipses indicate the heterotic loci detected using the dominant/overdominant model, while rectangles represent those detected using the additive model. Different colors represent different traits. (B–D) Distribution of the degree of dominance of heterotic loci in the 2014CS (B), 2015CS (C), and 2015HF (D) trials. Only loci representing all three genotypes (one heterozygous and two homozygous genotypes) in the hybrids were investigated.

