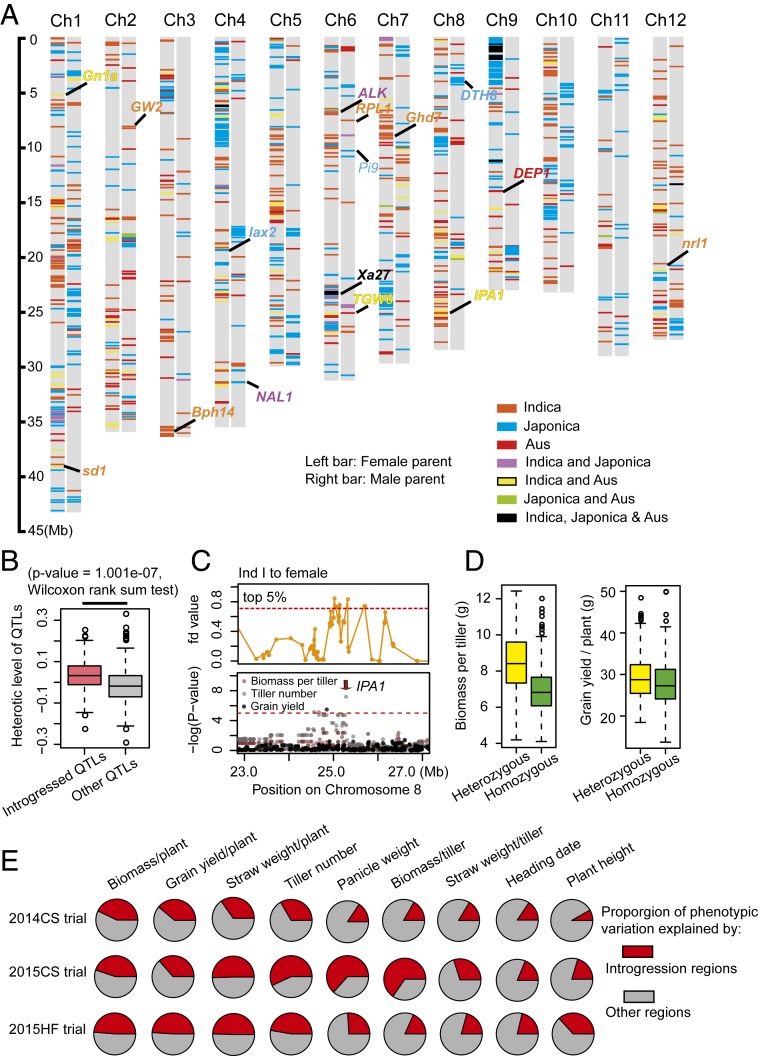
Fig. 3.
Exogenous genome introgression differences between male and female parents shape heterotic loci in the hybrids. (A) Distribution of introgressed genome regions in female (Left bar) and male (Right bar) parents. Introgressed regions were screened using the four-taxon fd statistic, which calculates excessively shared derived variants between two taxa. The cutoff to define introgressed regions from each subpopulation was determined based on the results of the population structure analysis. Different colors represent the origin of introgressed genomic segments. Aus represents the south Asia origin aus rice subpopulation. (B) Heterotic loci in the introgressed regions had greater heterotic effects than loci in other regions. The heterotic effect of each locus was defined as the proportion of the trait value in the heterozygous genotype that was different from the trait value in the homozygous genotype. (C) IPA1 was involved in genetic introgression from Ind I to female parents (Top) and was significantly associated with the variation in GYPP, TN, and biomass per plant (Bottom). (Top) Distribution of the fd value at the IPA1 locus. (Bottom) GWAS Manhattan plot of GYPP, TN, and biomass per tiller for the 2014CS trial at the IPA1 locus. (D) IPA1 locus has heterotic effect at biomass per tiller (Left) and grain yield per plant (Right). (E) Estimated heritability of introgressed regions and other regions across traits and trials. Genetic relatedness matrixes among individuals were calculated using variants within and outside of the introgressed regions. Heritability of the introgressed regions and other regions was then estimated from their genetic relatedness matrixes using the genome-based best linear unbiased prediction (G-BLUP) approach.

