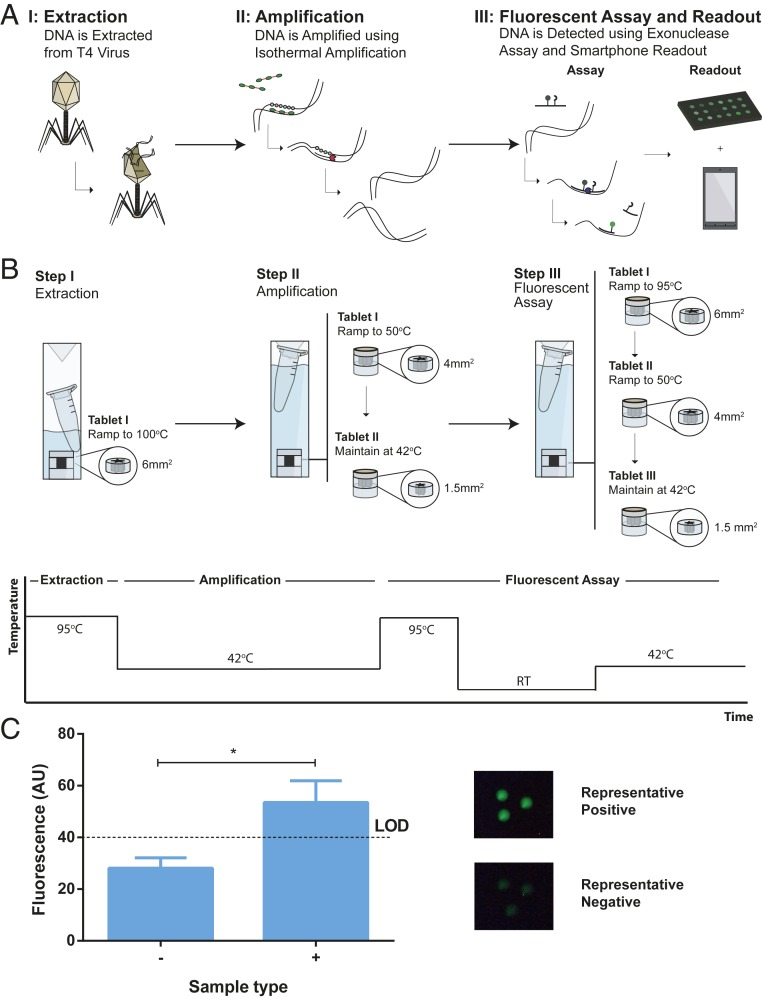
Fig. 5.
The use of miniature heaters in a diagnostic workflow. (A) Schematic of the diagnostic workflow. (A) The workflow involves extraction of DNA from T4 bacteriophage, amplification with RPA and fluorescence detection of the amplified DNA using a smartphone device. (B) Schematic showing the combination of heaters required to achieve each temperature. A stepwise temperature curve shows the different temperatures required to complete each step. (C) Final fluorescent results of the assay (n = 3). Representative images of a positive and a negative result are shown above. Each replicate was analyzed to determine average intensity using ImageJ. LOD, limit of detection. *P = 0.0194.

