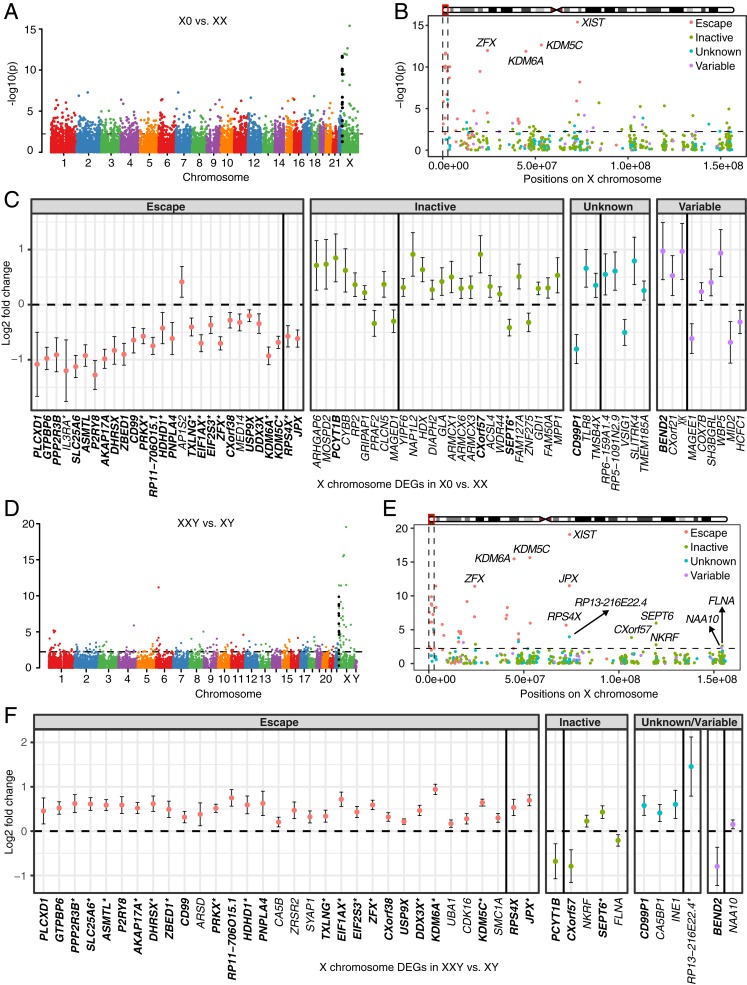
Fig. 1.
Differential expression analysis between TS patients and female controls (A–C), and between KS patients and male controls (D–F). −log10(P values) across the genome are shown in A for X0 vs. XX and in D for XXY vs. XY. Genes in PAR1 are colored in black. −log10(P values) across the X chromosome are shown in B for X0 vs. XX and in E for XXY vs. XY. Genomewide significance is based on false discovery rate (FDR) <0.05 indicated by the horizontal lines. PAR1 region is represented by the vertical black lines and genes are shown in four colors based on their XCI status in B and E. Log2 fold change and 95% confidence interval of DEGs on the X chromosome are shown in C for X0 vs. XX and in F for XXY vs. XY. DEGs are shown in four categories based on their XCI status. DEGs labeled by asterisk in C and F were also reported in Trolle et al. (9) and Skakkebæk et al. (18), respectively. Gene XIST (log2 fold change −11.4, 95% confidence interval [−12.9, −10] for X0 vs. XX; log2 fold change 12.9, 95% confidence interval [11.7, 14.0] for XXY vs. XY) is omitted for viewing purpose. Genes on the Xp and the Xq are separated by the black vertical line within each category. DEGs shared between TS and KS are highlighted in bold.

