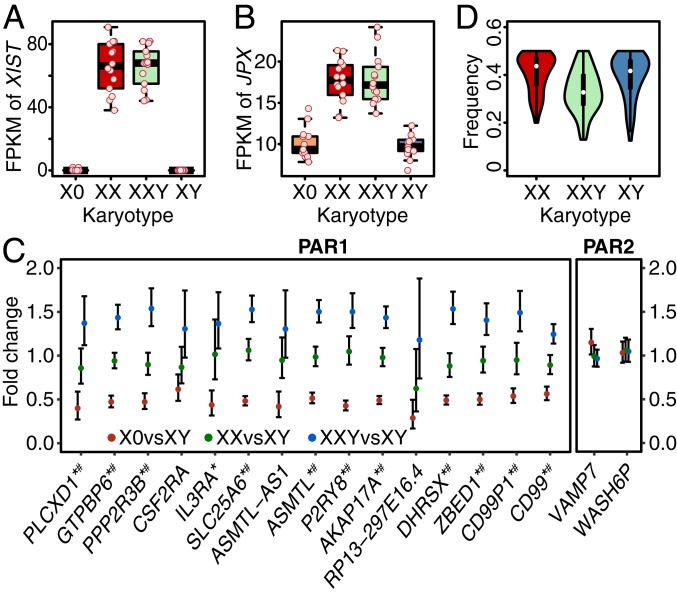
Fig. 2.
Expression levels of XIST (A) and JPX (B), and expression of genes in PARs (C and D). FPKM values are shown as points for all individuals for XIST (A) and JPX (B). Fold change of average expression levels of all expressed genes (FPKM > 1) in PAR1 and PAR2 are shown in C for X0 vs. XY, XX vs. XY, and XXY vs. XY. Expressions of these genes in males are the aggregated expressions of both X and Y chromosomes as sequencing reads cannot be distinguished in PARs due to homology. Genes labeled by asterisk are DEGs in X0 vs. XX and those labeled by number sign are DEGs in XXY vs. XY. Frequencies of the number of the reads mapped to the allele with lower expression are shown in D for exonic SNPs in PAR1 genes genotyped by array.

