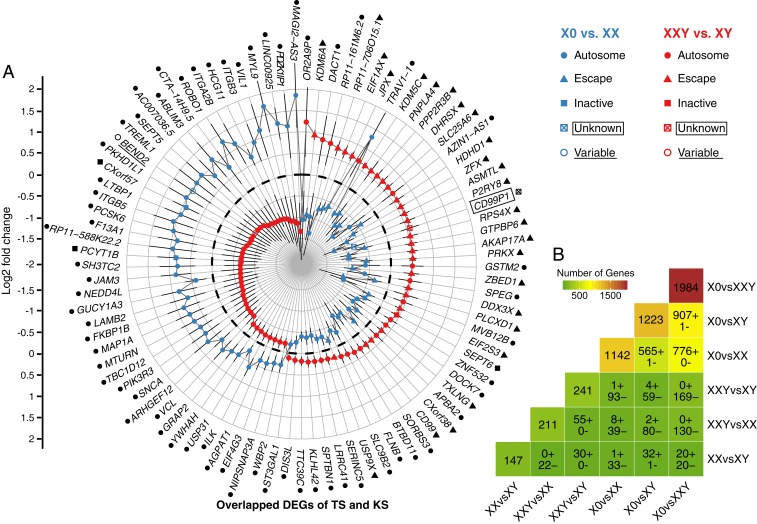
Fig. 3.
Shared DEGs between comparisons. (A) Shared DEGs in TS and KS. XIST is omitted for viewing purpose. DEGs on the X chromosome are shown in four categories based on XCI status: escape, variable escape, inactive and unknown status. Dashed black circle represents log2 fold change = 0. Autosomal genes and X chromosome genes with different XCI statuses are also labeled with black symbols after the gene names. (B) Number of DEGs in each comparison and shared DEGs between different comparisons. The number of DEGs for each comparison is shown in the diagonal cells. The number of shared DEGs with expression changes in the same direction (denoted by “+”) or opposite direction (denoted by “−”) between comparisons is shown in other cells. For the shared DEGs between X0vsXXY and XXvsXY, 15 of the 20 DEGs with the same direction of expression changes are on the Y chromosome, which is expected as the Y chromosome genes only express in XXY and XY.

