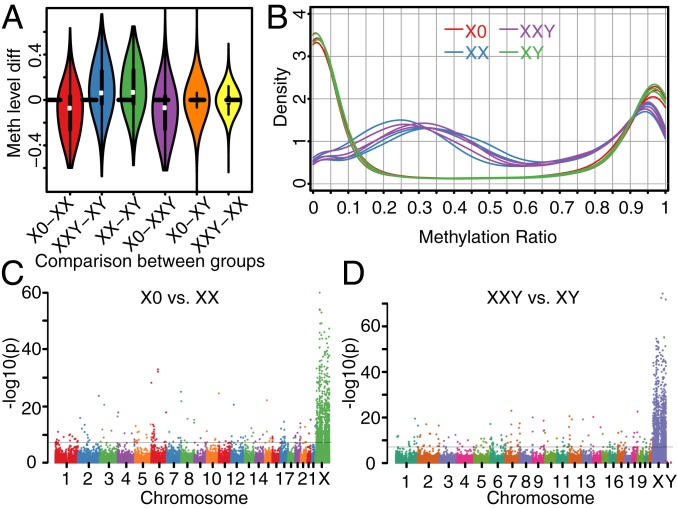
Fig. 4.
Comparison of methylation levels across groups. (A) Methylation level difference of the CpGs on the X chromosome for comparisons of different groups. (B) Distribution of methylation levels of CpGs on the X chromosome for individuals. (C) Differential methylation analysis between TS patients and female controls. (D) Differential methylation analysis between KS patients and male controls. −log10 (P values) across the genome are shown and genomewide significance is based on FDR <0.05 indicated by the horizontal black lines in C and D.

