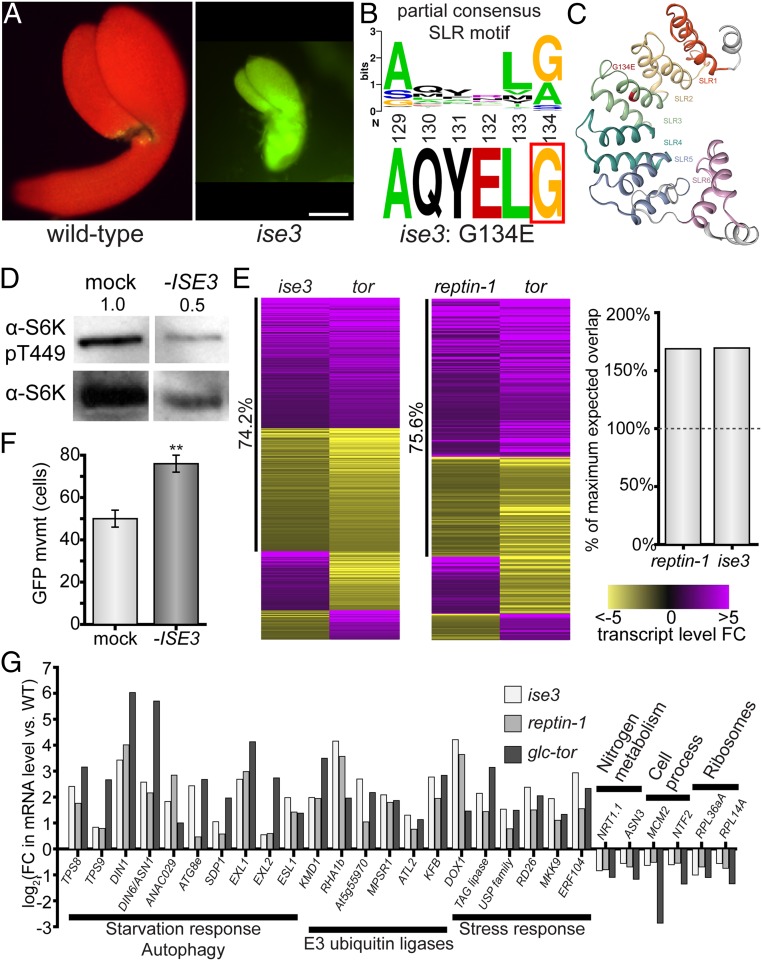
Fig. 3.
Dysfunctional mitochondria inhibit glucose-TOR signaling and increase cell–cell transport. (A) The 10 kDa FITC-dextran rapidly moves through ise3 midtorpedo-stage Arabidopsis embryos (Right) compared to wild-type siblings (Left; FITC, green; chlorophyll, red). (Scale bar, 100 µm.) (B) ise3 is a missense mutation, G134E, at a conserved G/A residue in SLR proteins. (C) Predicted structure of ISE3 protein, after cleavage of the mitochondrial transit peptide. ISE3 is composed of 6 Sel1-like repeats (SLR1–SLR6), of which SLR5 and SLR6 are relatively unstructured. ise3 is a missense G134E mutation at the consensus SLR glycine/alanine residue in SLR3 (indicated in red). (D) Silencing ISE3 with VIGS strongly reduces S6K-pT449 levels in Arabidopsis leaves, demonstrating that ISE3 promotes TOR activity. Total S6K levels are also shown. Numbers indicate S6K-pT449/S6K ratio relative to mock-infected leaves, across three replicates. (E) The glucose-TOR transcriptional program is disrupted in ise3 and reptin-1, reflecting TOR inactivity. Heatmaps show all overlapping significant DEGs between either the ise3 or reptin-1 mutant transcriptome and the tor transcriptome (41), with purple indicating increased transcript abundance and yellow indicating decreased transcript abundance, as indicated by the legend (Right). The number of overlapping genes in each pairwise comparison is significantly more than expected, as shown in the bar chart (Right; “100% maximum expected value” is the number of genes that could overlap with P > 0.05, as determined by a hypergeometric test; specifically P < 10−27 for reptin-1 and P < 10−62 for ise3). reptin-1 and ise3 transcriptomes show strong coregulation with the tor transcriptome (75.6% and 74.2% genes coregulated, respectively) (Datasets S2–S4). (F) Silencing ISE3 expression with VIGS increases PD transport in N. benthamiana leaves (n ≥ 59, **P < 0.001; error bars indicate SEM). (G) Representative DEGs affected in ise3, reptin-1, and tor compared to wild-type. Genes involved in starvation response/autophagy, proteasomal degradation, and stress response are induced in each mutant. Cytosolic ribosomal protein genes, cell process/cell cycle genes, and some nitrogen metabolism genes are repressed (SI Appendix, Fig. S4A and Datasets S2–S4).

