Fig. 1.
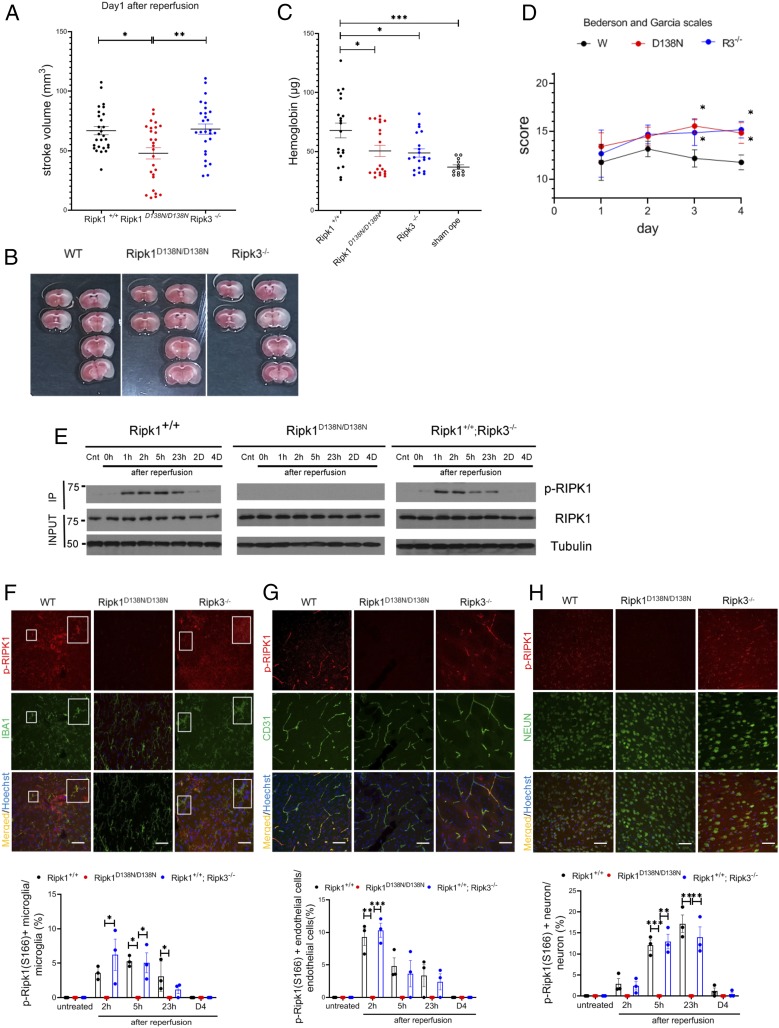
Activation of RIPK1 by ischemic insult. (A) WT, Ripk1D138N/D138N, and Ripk3−/− mice were subjected to transient 60-min MCAO, followed by reperfusion. The mice were killed after 23 h of reperfusion, and the brains were processed for TTC staining to measure infarct volume (n = 27 per group). (B) Representative TTC stainings from mice subjected to 60 min of ischemia followed by 23 h of reperfusion. (C) Quantification of hemorrhagic lesions by hemoglobin quantification in WT, Ripk1D138N/D138N, and Ripk3−/− mice treated as in A. (D) WT, Ripk1D138N/D138N, and Ripk3−/− mice were subjected to transient 60 min of MCAO followed by reperfusion, and were evaluated with Bederson and Garcia scales in a double-blinded manner daily from day 1 to day 4 after the MCAO procedure (n = 12 per group). The highest score is 21 points, and a higher score is correlated with better outcome. (E) Brain lysates from mice with indicated genotypes subjected to MCAO for 60 min followed by reperfusion for the indicated time periods were immunoprecipitated with p-S166 RIPK1 and then analyzed by immunoblotting with the indicated antibodies. (F–H, Upper) Sections of WT, Ripk1D138N/D138N, and Ripk3−/− mice treated with transient 60 min of MCAO followed by reperfusion for 23 h (F and H) or 3 h (G) and at different time points as indicated on the bar graphs were immunostained with p-S166 RIPK1 and coimmunostained with IBA1, CD31, or NeuN for IBA1+ microglia/infiltrated macrophages (F), cerebrovascular endothelial cells (G), and neurons (H), respectively. (Magnification: 40×; Sale bar: 50 μm.) (F–H, Lower) The quantification of the results. The data represent mean ± SEM. n = 3 mice for each time point. Assessment of each time point includes data from five sections for approximately 150 cells in each mouse. (F) The large square Insets (Right) are enlarged images of the small square Insets (Left). *P < 0.05, **P < 0.01, and ***P < 0.001.

