Fig. 2.
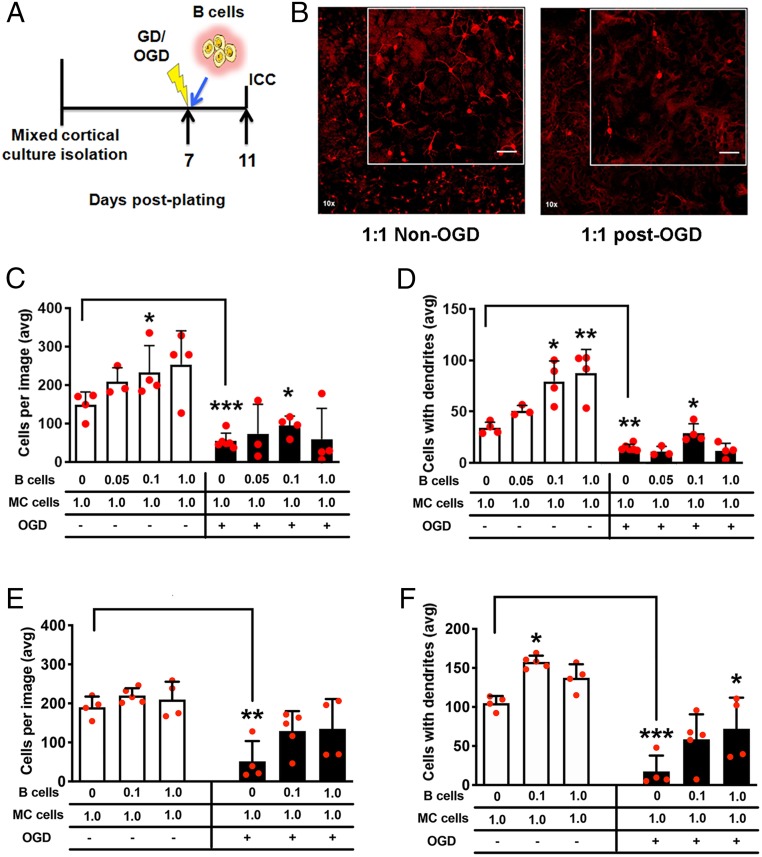
B cells induce a neurotrophic effect in mixed cortical cultures. (A) Experimental timeline for the placement of naïve B cells on culture after oxygen-glucose deprivation (OGD) and prior to immunocytochemistry (ICC). (B) Images at 10× of microtubule-associated protein (MAP2)+ neurons (red) for treatment (txn) groups; higher-magnification image is also shown (Inset). (Scale bar, 50 μm.) (C) Increasing ratio of B cells to mixed cortical (MC) cells increased the number of MAP2+ neurons, as well as (D) the number of MAP2+ neurons with dendrites, in the non-OGD experiments. OGD decreased overall numbers, with only a 0.1:1.0 B cell:mixed cortical cell ratio preserving neuronal survival and dendritic arborization. (E and F) Experiments were replicated with IL-10–deficient B cells (images shown in SI Appendix, Fig. S2). IL-10–deficient B cells (E) did not preserve cell survival after OGD, but (F) a 1:1 ratio did preserve dendritic arborization after OGD. Replicate, independent experiments (each with interexperimental replicates) are shown by red circles for total n. Nonparametric one-way ANOVA (Kruskal–Wallis) determined within-group significance, and t test was used for untreated non-OGD:OGD comparisons. Data graphed as mean ± SD, and significance determined by nonparametric one-way ANOVA or Student’s t test (*P < 0.05, **P < 0.01, ***P < 0.001 vs. untreated control unless otherwise indicated by brackets).

