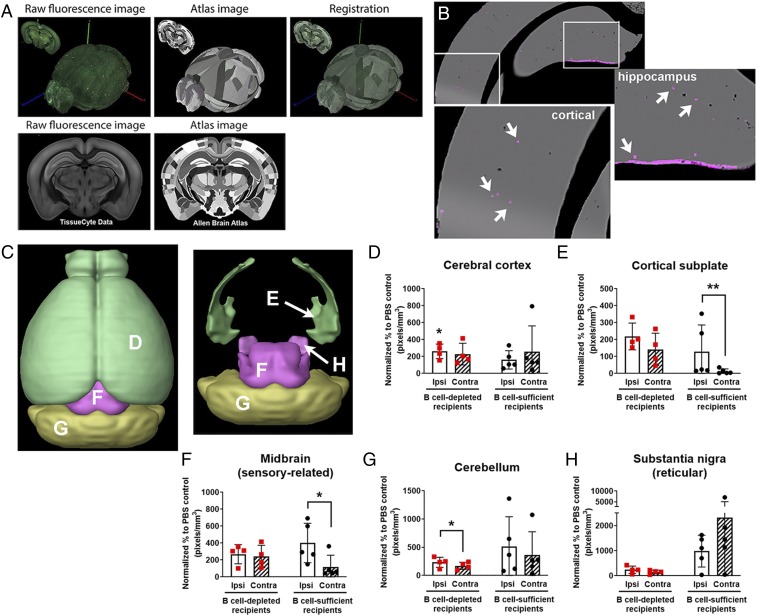
Fig. 4.
B cells show diapedesis into remote motor areas after stroke. (A) Serial two-photon tomography images are coregistered to the Allen Institute CCF3.0 to allow identification of region-specific fluorescence in 3D whole-brain probability maps. (Magnification: A, 16×.) (B) Representative areas classified as e450+ B cells via machine learning (punctate magenta dots [Insets], identified by white arrows) that show B cell diapedesis in cortex and hippocampus (enlarged areas indicated by white squares). (C) Three-dimensional surface renderings created with the Brain Explorer application (Allen Institute for Brain Science) show regions with bilateral B cell diapedesis after stroke, with areas labeled to the letter corresponding to the data graphs. (D–H) Quantification of e450+ B cell fluorescence in both B cell-depleted mice (red squares) and mice with endogenous B cells at time of stroke (black circles). Ipsilesional (ipsi, white bars) and contralesional (contra, hatched bars) brain regions show predominantly ipsilesional B cell diapedesis for (D) cerebral cortex, (E) cortical subplate, (F) midbrain, (G) cerebellum, and (H) substantia nigra with percent change (y-axes, pixels per cubic millimeter). Significance determined by paired t tests (*P < 0.05, **P < 0.01 vs. PBS controls unless indicated by brackets).

