Fig. 3.
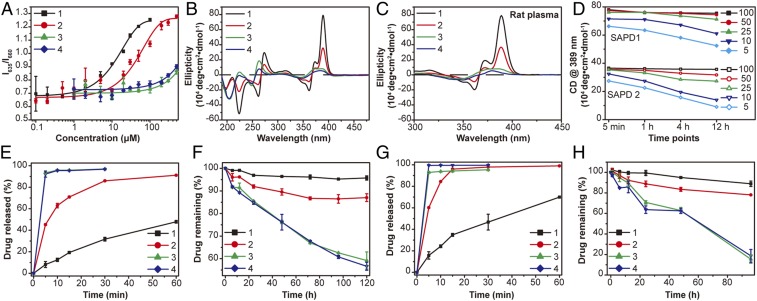
CMC, stability, and drug release studies of SAPDs. (A) CMC measurement of SAPDs using a Nile Red method. CMCs of SAPDs 1 and 2 are estimated to be 2.7 and 10.1 μM, respectively. CMCs of SAPDs 3 and 4 exceed 200 μM, and the exact values cannot be directly determined here. (B) CD spectra of SAPDs at 200 μM in water. SAPD 1 shows very strong absorptions attributed to CPT chromophore interactions and intermolecular hydrogen bonding. SAPD 2 shows a similar pattern with largely reduced intensities. The lack of typical hydrogen-bonding interactions and characteristic CPT absorptions in SAPDs 3 and 4 indicates that they may not form 1D nanostructures at the concentration of 200 μM. The chromophore absorptions can be ascribed to intramolecular CPT interactions within a single prodrug. (C) CD spectra of SAPDs at 200 μM in 10% rat plasma. No apparent difference in the absorptions of SAPDs 1 and 2 were observed compared with those in water, while slight changes can be seen in the cases of SAPDs 3 and 4. (D) Plots of absorption of SAPD 1 and SAPD 2 assemblies at 389 nm in the time- and concentration-dependent CD measurement. Drug release plots of SAPDs at 200 μM in PBS (E) and rat plasma (G) with 10 mM GSH. Cumulative drug degradation plots of SAPDs at 200 μM in PBS (F) and rat plasma (H) without GSH. n = 3 for all drug release studies.

