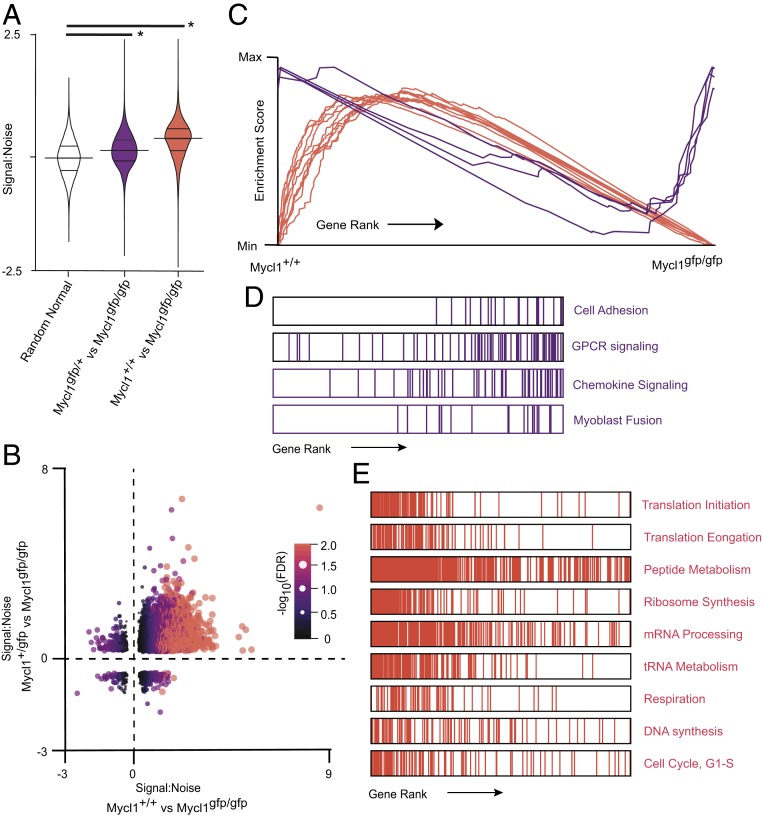
Fig. 3.
Mycl supports a dose-dependent transcriptional program that regulates core biosynthetic processes homeostatically in splenic cDC1s. (A) Violin plots of signal-to-noise ratios for 1000 differentially expressed genes ranked by false discovery rate (FDR). Signal-to-noise ratios are derived from independent expression microarray experiments that compared cDC1s from Myclgfp/gfp and Myclgfp/+ mice with splenic cDC1s from Mycl+/+ mice. Welch two-sample t tests were performed for each independent experiment compared with a random normal distribution of signal-to-noise ratios. *P < 2.2e−16. (B) Scatterplot of signal-to-noise ratios of genes with for the indicated experimental comparisons, with point color and size scaled to -log10(FDR). (C–E) Summary of results of GSEA for annotated GOs. (D and E) Representative examples of enrichment plots and respective rank-ordered gene sets. GSEA results are provided in SI Appendix, Tables S1 and S2.

