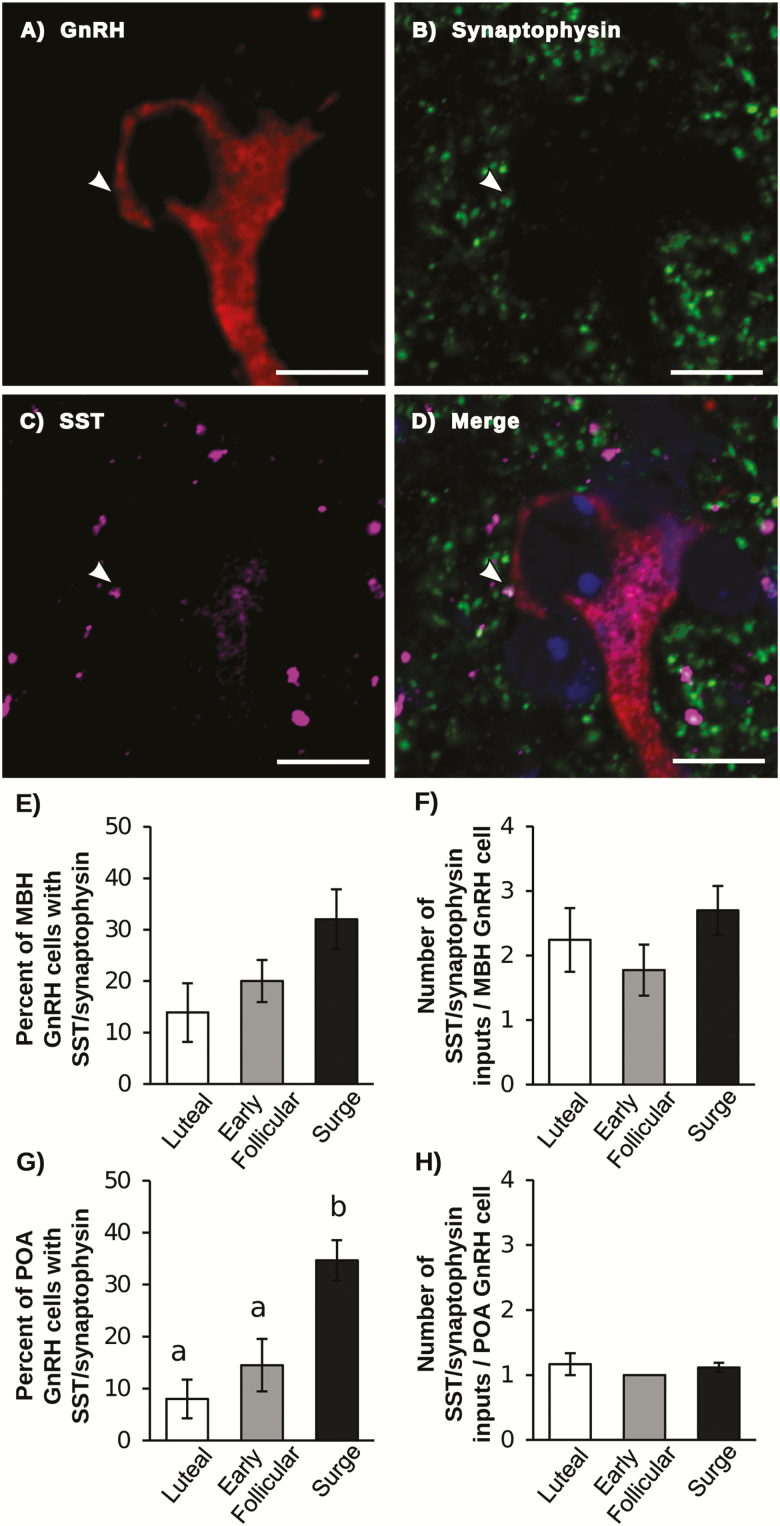
Figure 1.
Representative confocal image of a POA GnRH neuron (red; A) with synaptophysin (green; B) and SST (magenta; C) dual labeled contact (indicated by white arrow). (D) Merged image of GnRH, SST, synaptophysin and Neurotrace (blue). Scale bar = 10 μm. (E,G) Percentage of GnRH neurons in the MBH (E) and POA (G) that received at least 1 SST/synaptophysin contact. (F,H) Number of SST/synaptophysin inputs per GnRH neuron in the MBH (F) and POA (H). Bars with unique letters are significantly different (P < .05).

