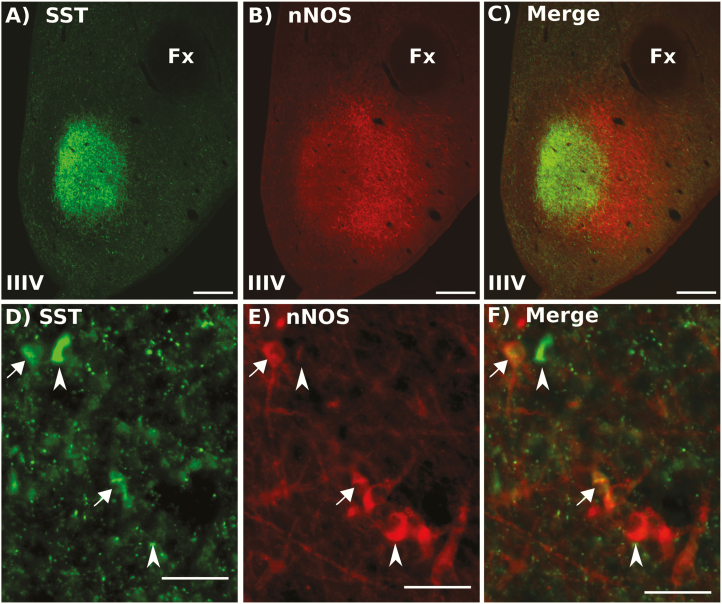
Figure 3.
Representative image of SST (green, A + D) and nNOS (red, B + E) immunolabeling in the VMN. Merged images shown in C and F. Scale bar in A–C = 500 μm, Scale bar for D–F = 50 μm. Arrows indicate dual-labeled cells; arrowheads indicate single labeled SST or nNOS cells. Fx, fornix; IIIV, third ventricle.

