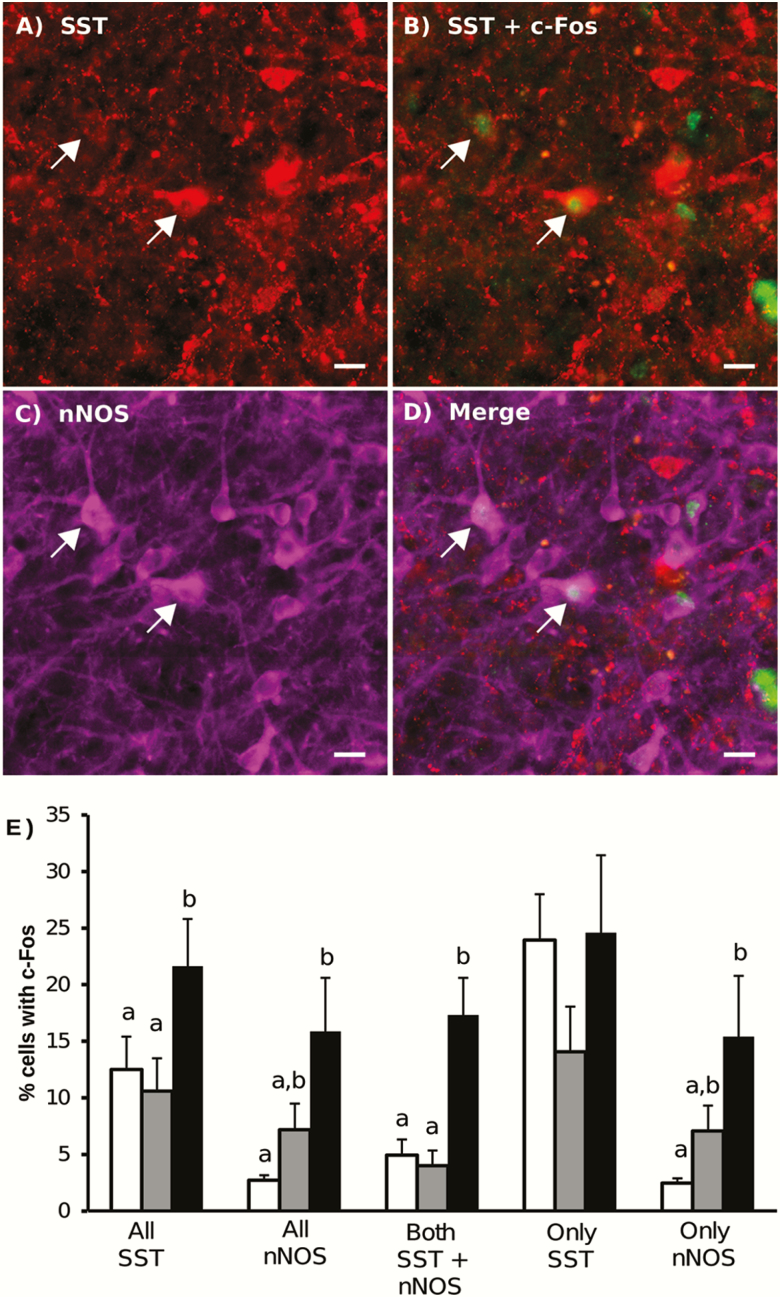
Figure 4.
Representative image of SST (red, A,B), c-Fos (green, B), nNOS (magenta, C) immunolabeling in the vlVMN in tissue collected during the LH surge. Merged images are shown in D. Scale bar = 20 μm. Arrows indicate dual-labeled SST and nNOS cells that contain c-Fos. (E) Quantification of SST and nNOS immunoreactive cells that contain c-Fos throughout the estrous cycle (white bars: luteal phase, grey bars: early follicular phase, black bars: LH surge). Bars with unique letters are significantly different (P < 0.05) within cell classification

