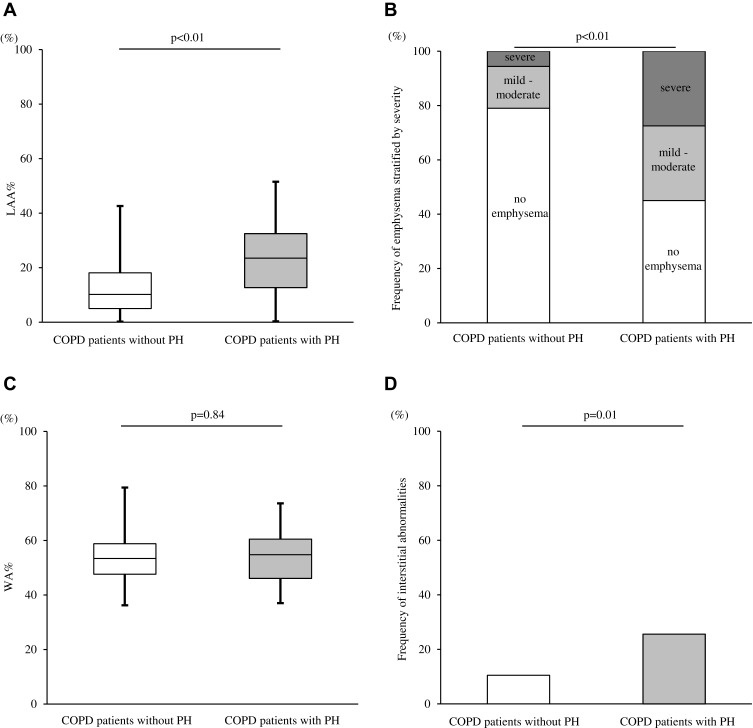
Figure 5.
Relationship between PH assessed by echocardiography and baseline chest CT abnormalities in COPD patients. (A) Comparison of LAA% between the two groups. (B) Frequencies of emphysema severities in the two groups. (C) Comparison of WA% between the two groups. (D) Frequencies of interstitial abnormalities in the two groups. Data were compared between groups using the Mann–Whitney U-test and χ2 test.
Abbreviations: PH, pulmonary arterial hypertension; CT, computed tomography; COPD, chronic obstructive pulmonary disease; LAA%, ratio of the low-attenuation area to the total lung volume; WA%, percentage of airway wall area.

