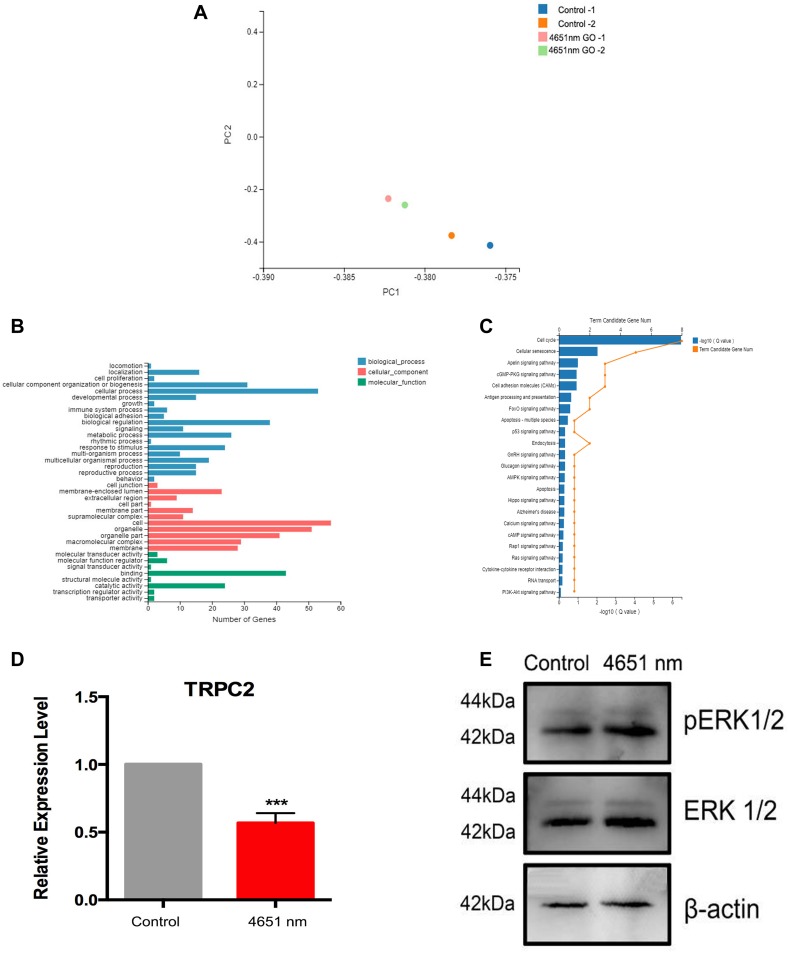
Figure 7.
Effects of 4651 nm graphene oxide nanoparticles on the differentiation mechanism of mNSCs. (A) 2D principal component analysis using the genome-wide expression data for the 4651 nm GO NPs and control group using R Studio. (B) KEGG pathway analysis of the genes regulated in the 4651 nm GO NP-treated mNSCs. (C) GO pathway analysis of the regulated genes in the 4651 nm GO NP-treated mNSC. (D) Relative mRNA expression levels of gene TRPC2, GAPDH was used for internal normalization in the quantitative RT-PCR. Data show the means ± standard error of the mean of three independent experiments. ***p < 0.001 compared with the control group. (E) Western blotting results.

