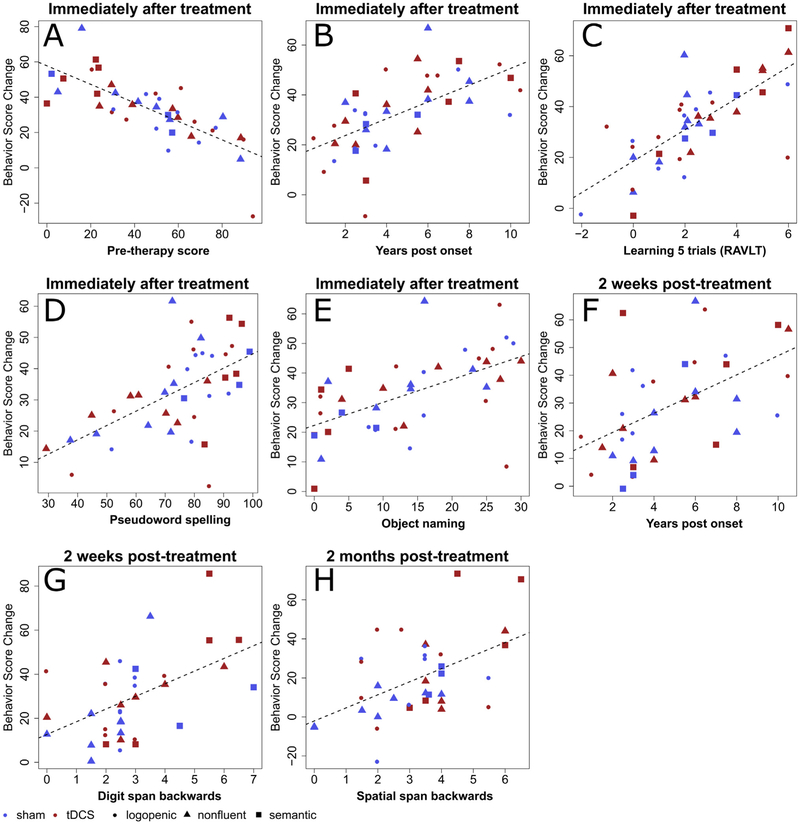
Fig. 3 –
Variables predicting improvement in spelling accuracy for trained words. Panels A–H contain scatter plots of therapy-related letter accuracy change in spelling versus values in predictor variables. The red solid symbols are data points of patients in the tDCS group, and the blue solid symbols represent the sham group. Circles represent individuals with lvPPA; triangles represent those with nfvPPA; and squares represent those with svPPA. Panels A to E show variables selected the first time-point, immediately after training. Panels F and G show variables selected for the second time-point, two weeks after training. Panel H shows the variable selected for the last time-point, two months after training.

