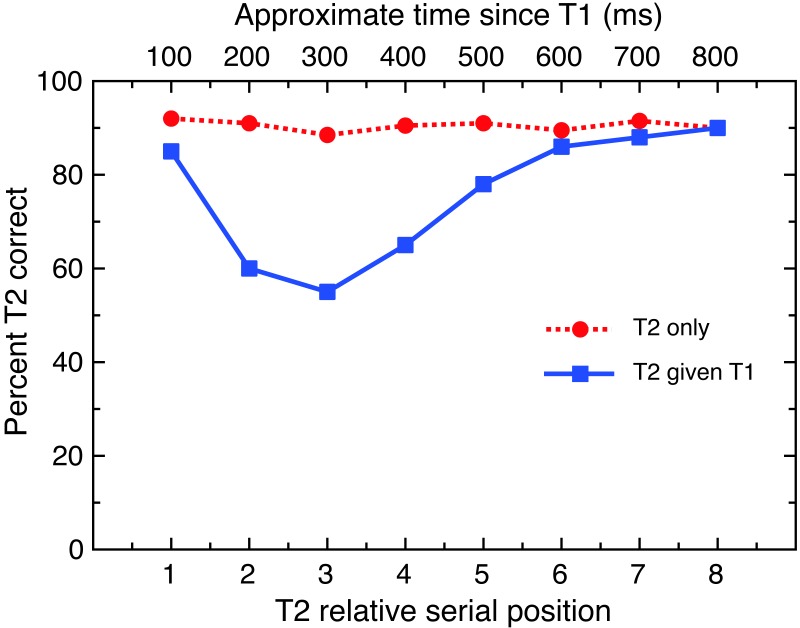
Figure 2. Typical results for an AB task.
This figure illustrates typical performance on attentional blink tasks, showing lag 1 sparing with intact performance at lag 1 and impaired performance at lags 2–5. Note T2—T1 (blue line) represents correct detection of T2 following correct detection of T1; T2 only (red line) represents correct detection of T2 when the observer is not required to detect T1.

