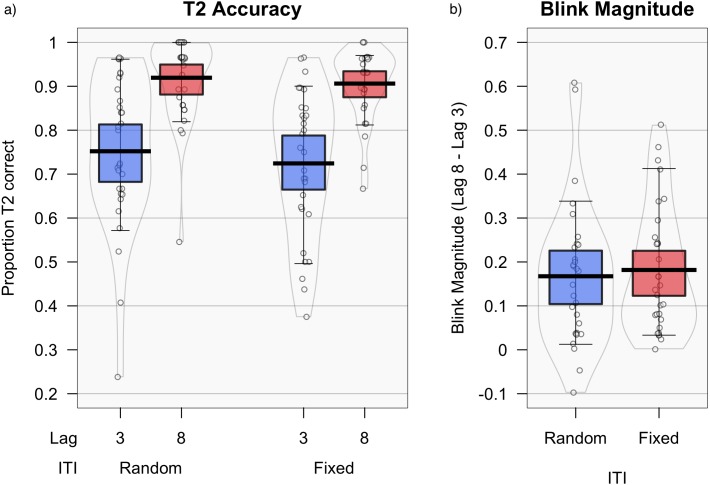
Figure 3. Accuracy and blink magnitude for random vs. fixed inter-trial intervals.
T2 — T1 accuracy (i.e., the proportion of T2 targets correctly identified for trials in which T1 was also correctly identified), comparing fixed and random ITI at each lag (A), and blink magnitude (B) (lag 8–lag 3). Means are shown by black horizontal bars. Individual scores are represented by black circles, slightly jittered for clarity; colored areas represent 95% Highest Density Intervals (HDIs), calculated using R’s BEST (Bayesian Estimation Supersedes the T-Test) package (Kruschke, 2013), and vertical bars represent the 10th and 90th quantiles.

