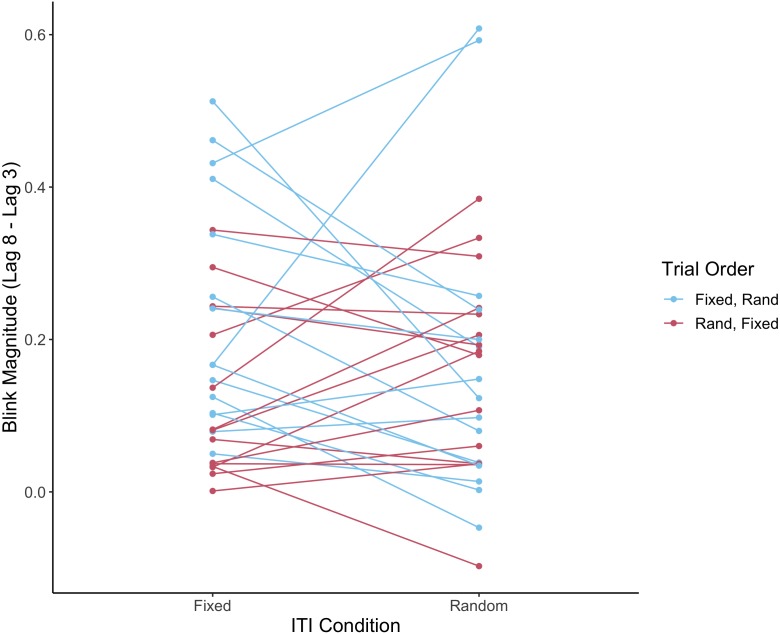
Figure 4. Individual subjects’ performance on fixed and random ITI conditions according to trial order.
The plot shows blink magnitude (lag 8 accuracy–lag 3 accuracy), comparing fixed and random ITI for the different trial order conditions (fixed ITI first and random ITI first). Individual subjects are represented by the linked points; fixed-first and random-first conditions are indicated by color.

