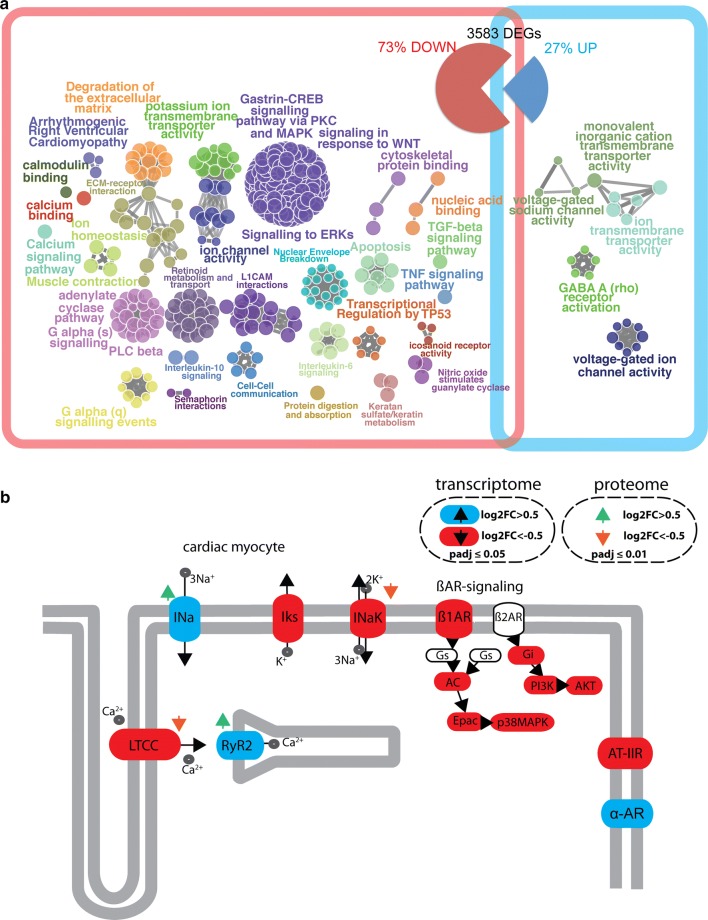
Fig. 5.
Transcriptomics and pathway analysis of CRISPLD1-KO-hiPSC-CM. a RNA-seq of CRISPLD1-KO-CM resulted in the identification of 3583 differentially expressed genes (DEGs) compared to WT-hiPSC-CM at day 60 (log2 Fold Change > 0.5/< − 0.5, adjusted p value < 0.05). 73% of the DEGs are downregulated and 27% are upregulated. Analysis of functionally organized gene ontology (GO)/pathway term network of down—(red square) and upregulated (blue square) significantly associated DEGs. The network represents GO/functional terms as nodes, which are linked based on a predefined kappa score level. The size of the nodes reflects the enrichment significance of the terms. Functional groups are colored and overlaid with the network. Functional groups are represented by their most significant (leading) term shown next to the corresponding group. b Simplified adrenergic signaling pathway in cardiomyocytes (pathway map adapted from KEGG entry hsa04261). Significantly regulated components are highlighted (transcriptome: upregulated = blue, downregulated = red; proteome: upregulated = green arrow, downregulated = orange arrow). LTCC = L-type calcium channel Iks = potassium voltage-gated channel INaK = Na + /K + -ATPase; AC adenylate cyclase, Epac Rap guanine nucleotide exchange factor, p38MAPK mitogen-activated protein kinase 11, Gi G protein subunit alpha i2, PI3K phosphoinositide-3-kinase, AKT AKT serine/threonine kinase, Ina cardiac sodium channel, RyR2 cardiac ryanodine receptor, ß1AR adrenoreceptor beta 1, AT-IIR angiotensin II receptor type 1, α-AR adrenoceptor alpha

